Ether (ETH) is down 11.5% in seven days even after the recent confirmation of the "Ethereum merge" transition to a proof-of-stake (PoS) consensus network in September. During the Ethereum core developers conference call on July 14, developer Tim Beiko proposed Sept. 19 as the tentative target date.
The transition out of energy-intensive mining has been delayed for years, and the journey toward scalability using sharding technology — parallel processing capability — is yet to be scheduled. Still, some analysts expect the network’s monetary policy to boost the value of Ether.
Ethereum researcher Vivek Raman highlighted the effect of the "supply shock" and according to the analyst, the "merge" will "reduce ETH's total supply by 90%," even though no benefit in transaction fees is to be seen in the current transition stage.
Regulatory uncertainty could be partially responsible for Ether's recent sharp correction. A class-action has been proposed against Yuga Labs for "inappropriately inducing" the community to buy nonfungible tokens (NFTs) and the ApeCoin (APE) token. Furthermore, the law firm claims that Yuga Labs used celebrity promoters and endorsements to "inflate the price" of the BAYC NFTs and the APE tokens.
Moreover, on July 26, Infrawatch PH, a think tank in the Philippines, filed a complaint to the local regulator to crack down on Binance's activities and alleged unregistered operations. The petition claims that the exchange has no office in Manila and only uses "third-party companies" for its technical and customer support services.
Options traders are nowhere near optimistic
Investors should look at Ether's derivatives markets data to understand how whales and arbitrage desks are positioned. The 25% delta skew is a telling sign whenever traders overcharge for upside or downside protection.
If those market participants feared an Ether price crash, the skew indicator would move above 10%. On the other hand, generalized excitement reflects a negative 10% skew.
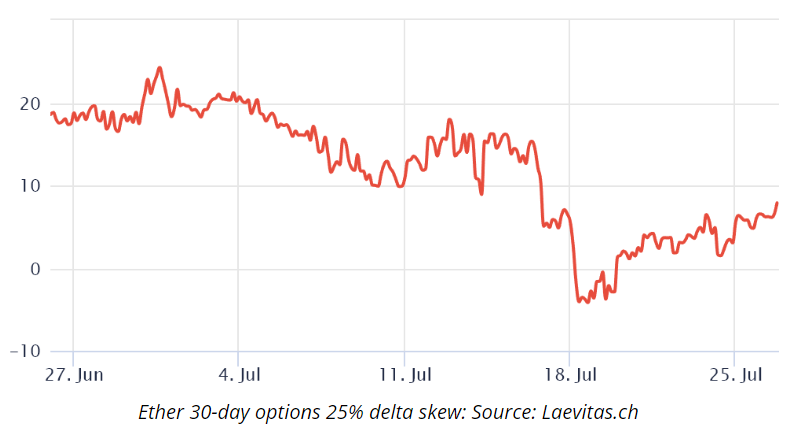
The skew indicator exited the "fear" zone on July 16 as Ether broke above $1,300, its highest level in 33 days. However, the improvement in traders' sentiment was not enough to instill confidence as the metric has since remained at the "neutral" threshold. ETH option traders are currently assessing similar upside and downside price movement risks.
Long-to-short data show a modest improvement in sentiment
The top traders' long-to-short net ratio excludes externalities that might have solely impacted the options markets. This metric gathers data from exchange clients' positions on the spot, perpetual and quarterly futures contracts, thus better informing on how professional traders are positioned.
There are occasional methodological discrepancies between different exchanges, so readers should monitor changes instead of absolute figures.
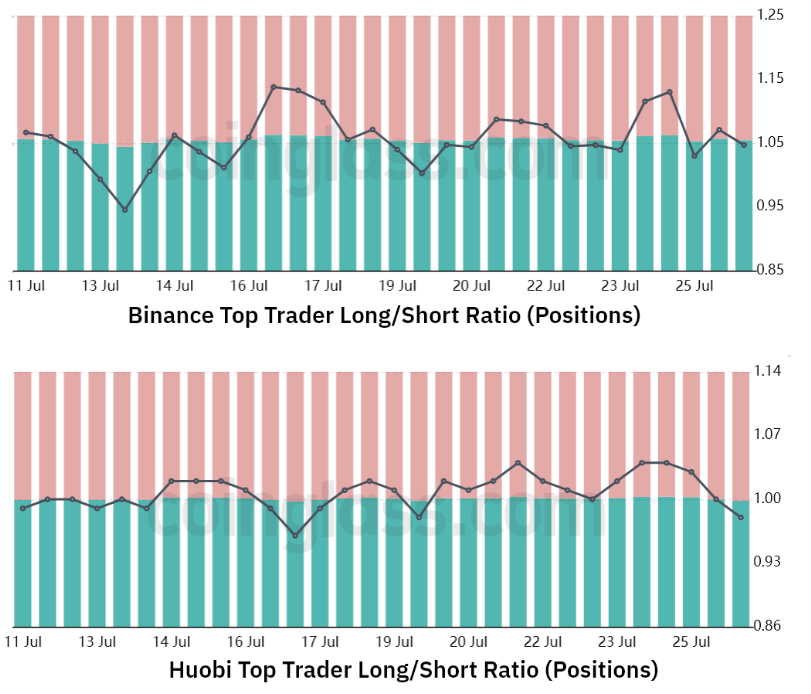
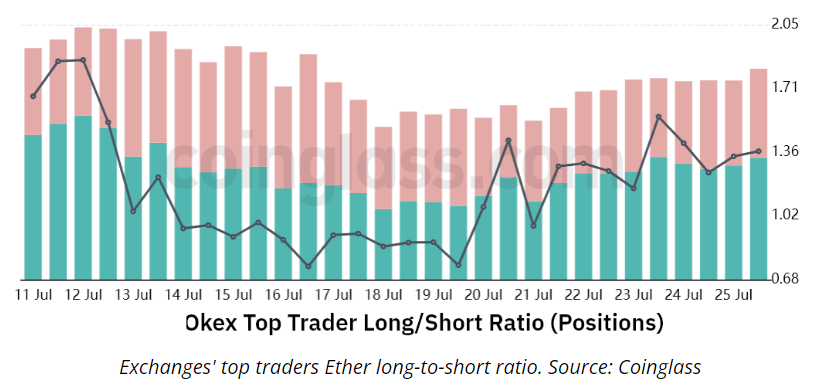
Even though Ether has failed to break the $1,600 resistance, professional traders did not reduce their leverage long positions between July 19 and 26, according to the long-to-short indicator.
Binance traders long-to-short ratio failed to hold the 1.13 mark but finished the period at the same level it started, near 1.05. Huobi displayed a modest decrease in its long-to-short ratio, as the indicator moved from 1.02 to the current 0.98 in seven days.
However, at the OKX exchange, the metric drastically increased within the period, from 0.88 on July 19 to the present 1.37. Thus, on average, traders increased their bullish positions in seven days.
There hasn't been a significant change in whales and market makers' leverage positions despite Ether's 11.5% correction since July 19. Furthermore, options traders are pricing similar risks for Ether's upside and downside moves, while leverage futures players slightly increased their bullish bets. The overall derivatives metrics reading is positive even though ETH failed to break the $1,600 resistance.
The views and opinions expressed here are solely those of the author and do not necessarily reflect the views of Cointelegraph. Every investment and trading move involves risk. You should conduct your own research when making a decision.