KAITO Desata una Ola Alcista: ¿Podrá Continuar la Subida del 21% o se Desvanecerá el Impulso?

TheNewsCryptoPubblicato 2025-12-27Pubblicato ultima volta 2025-12-27

Introduzione

El amplio mercado de criptomonedas muestra indecisión, con activos principales como Bitcoin y Ethereum en tendencia bajista. Sin embargo, KAITO ha roto esta tendencia con un sólido aumento del 21.46%, pasando de un rango bajo de $0.4898 a un máximo de $0.6387, superando resistencias clave. En el momento del análisis, cotiza alrededor de $0.6085, con una capitalización de mercado de $147.15 millones y un volumen de negociación que se disparó un 1387%, alcanzando $110.76 millones. Indicadores técnicos como el MACD muestran una cruz alcista, sugiriendo fortaleza de los compradores, mientras el CMF en 0.61 indica fuerte presión compradora. Esto podría impulsar el precio hacia $0.61 y posiblemente a $0.62 si se mantiene el momentum. No obstante, el RSI en 73.93 señala condiciones de sobrecompra, lo que advierte sobre un posible retroceso o consolidación. Un cambio bajista podría llevar el precio a soportes de $0.59 o incluso $0.58. Aunque el impulso alcista es notable, se recomienda precaución debido a la posible corrección.

El mercado criptográfico en general sigue siendo volátil, oscilando entre números rojos y verdes, lo que refleja una indecisión continua. Los activos más grandes como Bitcoin (BTC) y Ethereum (ETH) mantienen una trayectoria bajista prolongada, perdiendo impulso. Notablemente, KAITO ha roto la tendencia, registrando un sólido y constante salto del 21,46%.

En las primeras horas, el activo se negociaba dentro de un rango bajo de $0.4898. El encuentro alcista ha impulsado a KAITO a ascender hacia un nivel alto de $0.6387, probando y rompiendo las resistencias cruciales entre $0.49 y $0.62. Si los toros mantienen la fuerza, el mercado podría preparar el escenario para un rally hacia nuevos máximos.

Al momento de escribir, KAITO cotizaba en la zona de $0.6085, con su capitalización de mercado alcanzando los $147.15 millones. Además, el volumen diario de negociación del activo se ha disparado en más de un 1387%, tocando la marca de $110.76 millones. Según datos de Coinglass, el mercado ha experimentado una liquidación de $1.14 millones en KAITO en 24 horas.

Después de la Subida, ¿Pueden los Toros de KAITO Mantener la Línea?

La línea de Convergencia/Divergencia de la Media Móvil (MACD) de KAITO ha cruzado por encima de la línea de señal, mostrando la presencia de toros. Además, la tendencia podría continuar subiendo. Por otro lado, el indicador de Flujo de Dinero de Chaikin (CMF) situado en 0.61 implica una fuerte presión compradora, con un flujo constante de capital hacia el activo. Si se mantiene así de alto, probablemente respalde la tendencia alcista.

Con la perspectiva alcista, el precio de KAITO podría saltar hacia el nivel de resistencia de $0.61. Al mantener esta zona de negociación, los toros podrían desencadenar una corrección alcista potencial y provocar que se produzca el cruce dorado. Eventualmente, el precio podría subir a $0.62.

Una reversión a la baja podría abrir el camino a los mínimos recientes, lo que conlleva una repetición de la prueba en el soporte de $0.59. Una presión bajista sostenida podría hacer emerger el cruce de la muerte, y los osos probablemente llevarían el precio de KAITO al rango de $0.58 o incluso más bajo.

El valor del Poder Toro/Oso (BBP) de KAITO de 0.1560 indica una fuerza alcista moderada, pero el impulso no es fuerte. Si sube más, la presión compradora podría aumentar. Además, el Índice de Fuerza Relativa (RSI) diario se situó en 73.93, sugiriendo que el activo está sobrecomprado. Podría estar listo para un retroceso o consolidación. Aunque el impulso alcista es fuerte, se recomienda precaución.

Noticias Cripto Actualizadas Principales

Chequeo de Impulso: ¿Puede XDC Network Recargarse hacia sus Máximos Recientes, o Está en Juego un Retroceso?

EtiquetasAltcoinCriptomonedaKAITO

Crypto di tendenza

Domande pertinenti

Q¿Qué ha hecho KAITO en contraste con la tendencia general del mercado de criptomonedas?

AKAITO ha mostrado un sólido y constante aumento del 21,46%, en contraste con la tendencia bajista prolongada de activos más grandes como Bitcoin (BTC) y Ethereum (ETH).

Q¿A qué nivel de resistencia clave podría subir el precio de KAITO según el análisis técnico presentado?

ASegún el análisis, con el panorama alcista, el precio de KAITO podría subir hacia el nivel de resistencia de 0,61 dólares y eventualmente alcanzar los 0,62 dólares.

Q¿Qué indicador sugiere que KAITO está en territorio de sobrecompra y qué podría implicar esto?

AEl Índice de Fuerza Relativa (RSI) diario, que se situó en 73,93, sugiere que el activo está en territorio de sobrecompra, lo que podría indicar que está próximo a un retroceso o a una fase de consolidación.

Q¿Qué dato sobre el volumen de trading de KAITO se destaca en el artículo y cuál fue su incremento?

AEl volumen diario de trading de KAITO se disparó más de un 1387%, alcanzando la marca de 110,76 millones de dólares.

QSegún el indicador Chaikin Money Flow (CMF), ¿cómo es la presión compradora en el mercado de KAITO?

AEl indicador Chaikin Money Flow (CMF), que se encuentra en 0,61, implica una fuerte presión compradora, con un flujo constante de capital hacia el activo.

Letture associate

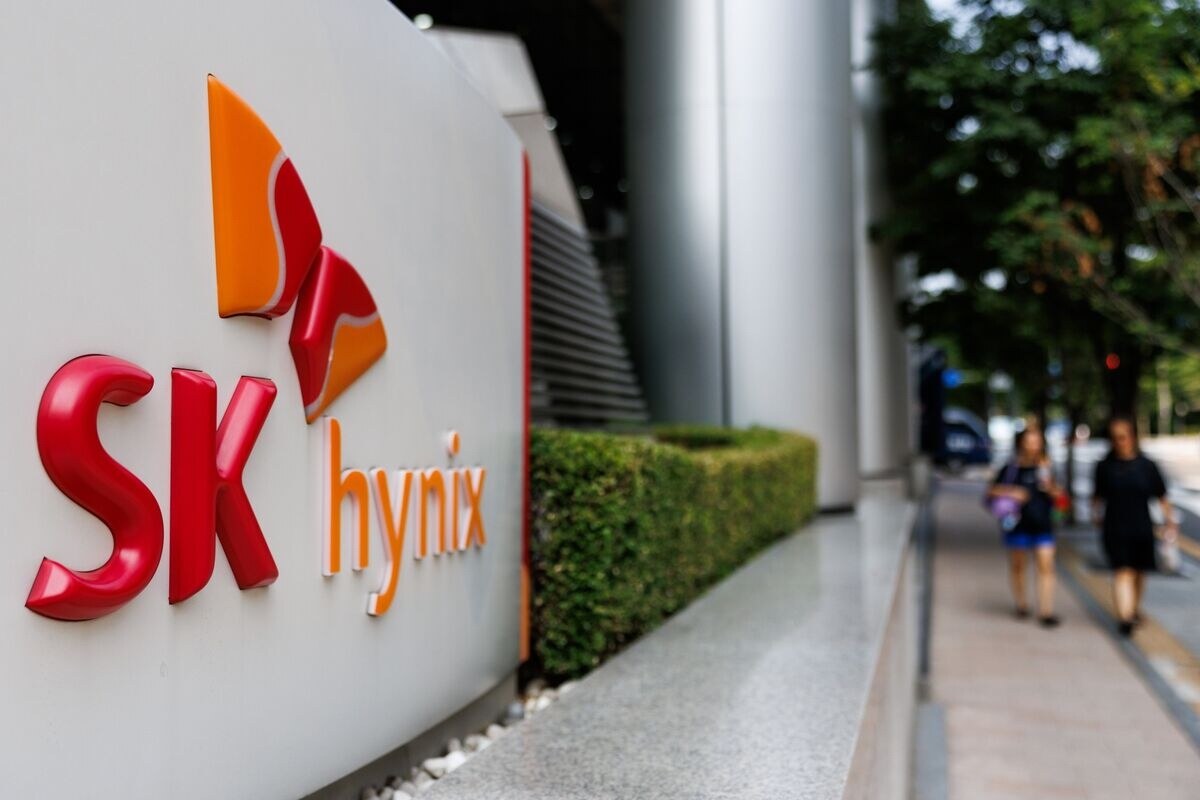
Sevenfold Oversubscription, Can SK Hynix Save the Semiconductor Industry This Time?

SK Hynix's planned US ADR listing is drawing intense interest, with its offering reportedly oversubscribed by over seven times, potentially making it the largest foreign listing in US history. The fundraising of approximately $24.5 billion is intended for expanding its Korean production capacity, including advanced packaging and EUV equipment. This massive demand from long-term funds and prominent institutions like Baillie Gifford and Situational Awareness Partners (led by noted investor Leopold Aschenbrenner) presents a stark contrast to the recent downturn in the broader semiconductor sector. The sector has faced a significant correction, with SK Hynix's own stock falling nearly 30% from its June high. This sell-off was triggered by concerns that major tech giants might slow their AI infrastructure spending, following signals like Meta's reported plan to sell surplus computing capacity. The strong ADR appetite suggests long-term investors still believe in the AI investment cycle's fundamentals, viewing the recent decline more as a valuation reset than a demand collapse. Some market speculation even suggests the pre-IPO price drop could be strategic, setting the stage for a stronger post-listing performance. While SK Hynix's successful listing may act as a short-term positive catalyst for market sentiment, the article argues the true signal for a sustained semiconductor recovery will come from upcoming earnings reports of tech giants like Microsoft, Google, Meta, and Amazon. Their future capital expenditure plans will be crucial in determining whether the AI-driven growth cycle can continue.

Odaily星球日报16 min fa

Sevenfold Oversubscription, Can SK Hynix Save the Semiconductor Industry This Time?

Odaily星球日报16 min fa

Breaking News: Musk Delivers the Most Powerful Grok 4.5, Slashes Price of Top-tier Opus Intelligence Drastically

**Elon Musk Launches Grok 4.5: A Cost-Effective, High-Performance AI Rival** SpaceXAI, in collaboration with Cursor, has released Grok 4.5, its new flagship AI model designed specifically for coding and agentic tasks. Trained on tens of thousands of NVIDIA GB300 GPUs using massive, high-quality data filtered from trillions of Cursor developer interactions, the model emphasizes "per-token intelligence." In benchmark performance, Grok 4.5 is highly competitive. It scores 64.7% on SWE Bench Pro (surpassing GPT-5.5's 58.6% and Opus 4.7's 64.3%), 83.3% on Terminal Bench 2.1 (nearly matching GPT-5.5), and 62.0% on DeepSWE 1.0 (beating Opus 4.8). Overall, it ranks fourth in AAAI official tests and first in the Harvey legal agent benchmark. The model's key advantage is its combination of speed, efficiency, and low cost. It generates responses at 80 tokens per second and, crucially, uses far fewer tokens to complete tasks—4.2 times fewer than Opus 4.8 on SWE Bench Pro. It is priced at $2 per million input tokens and $6 per million output tokens, significantly undercutting competitors. Musk stated it is "roughly equivalent to Opus 4.7, but much faster." Early user tests show Grok 4.5 can generate functional code for applications like 3D solar system simulators and basic games from simple prompts, though some note it still lags behind top models in certain creative tasks. Musk has hinted at a major update next month, leveraging real-world engineering data from his companies, with an even larger 2-trillion parameter version reportedly in development. Grok 4.5 positions itself not as the absolute strongest model, but as a highly efficient and affordable alternative in the top tier.

marsbit20 min fa

Breaking News: Musk Delivers the Most Powerful Grok 4.5, Slashes Price of Top-tier Opus Intelligence Drastically

marsbit20 min fa

Today, The Hong Kong Exchange Was Once Again Overwhelmed

Hong Kong's stock exchange witnessed an exceptionally busy day on July 9, with a record seven companies conducting initial public offerings (IPOs) simultaneously. The list included major firms such as Luxshare Precision, which launched the largest Hong Kong IPO of the year, and other notable names like Tri-Ring Group and Qiyunshan Food. However, the market reception was sharply divided on the first trading day. While Qiyunshan Food's shares surged over 110%, several other newcomers, including Luxshare Precision, Dingtai High-Tech, and Rigol Technologies, opened below their issue prices, with some falling nearly 20%. This event highlights a broader, bustling IPO scene in Hong Kong for 2024, with 82 Chinese companies listing in the first half alone—more than double the figure from the same period last year. A significant portion of this activity comes from dual "A+H" listings, where mainland China-listed firms seek secondary listings in Hong Kong. These larger companies have accounted for nearly 60% of total fundraising. Despite the high volume, recent trends show a cooling market sentiment for many new listings. Several IPOs in early July, including that of Tongrentang Healthcare, debuted with significant losses, indicating increased investor caution and selectivity. The market narrative is shifting, with capital increasingly concentrating on high-growth sectors like artificial intelligence, robotics, and semiconductors, while traditional manufacturing and consumer goods face greater pressure and volatility. This divergence underscores a market where success is no longer guaranteed by merely listing, but depends heavily on a company's growth prospects and sector appeal.

marsbit24 min fa

Today, The Hong Kong Exchange Was Once Again Overwhelmed

marsbit24 min fa

Glassnode: Crypto Market Enters Later Stages of Bottoming Phase

Glassnode: Crypto Market Enters Later Stages of Bottom Formation Bitcoin has traded below the true market average and the short-term holder cost basis for five consecutive months, indicating a deep undervaluation. On-chain data reveals a significant shift in selling pressure, with long-term holders now accounting for 43% of all realized losses. Daily realized losses for this group recently peaked at $280 million, the highest level since December 2022. While this large-scale capitulation is a hallmark of bear market bottoms, a sustained decline in this metric is a prerequisite for a sustained recovery. Institutional demand remains weak. US spot Bitcoin ETFs continue to see monthly net outflows, although the pace has moderated from June's peak. Furthermore, average daily ETF trading volumes have contracted by approximately 80% from their October 2025 peak, reflecting subdued institutional participation. Derivatives markets present a mixed picture. Overall positioning has shifted to cautiously bullish, with the put/call ratio dropping to a yearly low. However, the options volatility skew remains elevated, signaling that traders are still paying a premium for downside protection. The spot price also trades below the gamma "max pain" level. In summary, multiple indicators suggest the market is in the later phases of a bottoming process, characterized by long-term holder capitulation and weak institutional inflows. However, key confirmation signals for a durable trend reversal—a sustained drop in long-term holder selling pressure, stabilization of ETF flows, and a price recovery above key cost bases—are still pending.

Foresight News51 min fa

Glassnode: Crypto Market Enters Later Stages of Bottoming Phase

Foresight News51 min fa

Trading

Spot

Articoli Popolari

Come comprare O

Benvenuto in HTX.com! Abbiamo reso l'acquisto di O1 exchange (O) semplice e conveniente. Segui la nostra guida passo passo per intraprendere il tuo viaggio nel mondo delle criptovalute.Step 1: Crea il tuo Account HTXUsa la tua email o numero di telefono per registrarti il tuo account gratuito su HTX. Vivi un'esperienza facile e sblocca tutte le funzionalità,Crea il mio accountStep 2: Vai in Acquista crypto e seleziona il tuo metodo di pagamentoCarta di credito/debito: utilizza la tua Visa o Mastercard per acquistare immediatamente O1 exchangeO.Bilancio: Usa i fondi dal bilancio del tuo account HTX per fare trading senza problemi.Terze parti: abbiamo aggiunto metodi di pagamento molto utilizzati come Google Pay e Apple Pay per maggiore comodità.P2P: Fai trading direttamente con altri utenti HTX.Over-the-Counter (OTC): Offriamo servizi su misura e tassi di cambio competitivi per i trader.Step 3: Conserva O1 exchange (O)Dopo aver acquistato O1 exchange (O), conserva nel tuo account HTX. In alternativa, puoi inviare tramite trasferimento blockchain o scambiare per altre criptovalute.Step 4: Scambia O1 exchange (O)Scambia facilmente O1 exchange (O) nel mercato spot di HTX. Accedi al tuo account, seleziona la tua coppia di trading, esegui le tue operazioni e monitora in tempo reale. Offriamo un'esperienza user-friendly sia per chi ha appena iniziato che per i trader più esperti.

66 Totale visualizzazioniPubblicato il 2026.06.19Aggiornato il 2026.06.29

Come comprare O

Come comprare PROS

Benvenuto in HTX.com! Abbiamo reso l'acquisto di Pharos (PROS) semplice e conveniente. Segui la nostra guida passo passo per intraprendere il tuo viaggio nel mondo delle criptovalute.Step 1: Crea il tuo Account HTXUsa la tua email o numero di telefono per registrarti il tuo account gratuito su HTX. Vivi un'esperienza facile e sblocca tutte le funzionalità,Crea il mio accountStep 2: Vai in Acquista crypto e seleziona il tuo metodo di pagamentoCarta di credito/debito: utilizza la tua Visa o Mastercard per acquistare immediatamente PharosPROS.Bilancio: Usa i fondi dal bilancio del tuo account HTX per fare trading senza problemi.Terze parti: abbiamo aggiunto metodi di pagamento molto utilizzati come Google Pay e Apple Pay per maggiore comodità.P2P: Fai trading direttamente con altri utenti HTX.Over-the-Counter (OTC): Offriamo servizi su misura e tassi di cambio competitivi per i trader.Step 3: Conserva Pharos (PROS)Dopo aver acquistato Pharos (PROS), conserva nel tuo account HTX. In alternativa, puoi inviare tramite trasferimento blockchain o scambiare per altre criptovalute.Step 4: Scambia Pharos (PROS)Scambia facilmente Pharos (PROS) nel mercato spot di HTX. Accedi al tuo account, seleziona la tua coppia di trading, esegui le tue operazioni e monitora in tempo reale. Offriamo un'esperienza user-friendly sia per chi ha appena iniziato che per i trader più esperti.

67 Totale visualizzazioniPubblicato il 2026.06.22Aggiornato il 2026.06.29

Come comprare PROS

Cosa è VERONA

I. Introduzione al Progetto VERONA è una blockchain costruita per tutti, ovunque attraverso l'astrazione della catena. Utilizzando il suo livello di astrazione generalizzato, VERONA si distingue integrando funzionalità blockchain complesse, come conti, firme e interoperabilità, direttamente a livello di protocollo. Questo approccio consente di interagire con le applicazioni blockchain senza la necessità di comprendere le tecnologie sottostanti.1) Informazioni di Base Nome:VERONA(VERONA)III. Link Correlati Link al sito ufficiale:https://xion.burnt.com/ Whitepaper:https://xion.burnt.com/whitepaper.pdf Esploratori:https://explorer.burnt.com/ Social Media: https://x.com/burnt_xion Nota: L'introduzione al progetto proviene dai materiali pubblicati o forniti dal team ufficiale del progetto, che è solo a scopo di riferimento e non costituisce consulenza per investimenti. HTX non si assume responsabilità per eventuali perdite dirette o indirette risultanti.

89 Totale visualizzazioniPubblicato il 2026.06.22Aggiornato il 2026.06.22

Cosa è VERONA

Discussioni

Benvenuto nella Community HTX. Qui puoi rimanere informato sugli ultimi sviluppi della piattaforma e accedere ad approfondimenti esperti sul mercato. Le opinioni degli utenti sul prezzo di A A sono presentate come di seguito.

活动图片