Kaspa [KAS] 飙升 13% – 但此阻力区发出警告!

ambcryptoPubblicato 2025-07-23Pubblicato ultima volta 2025-07-23

Introduzione

由于阻力区引发谨慎情绪,KAS 看涨走势面临障碍。

关键要点

KAS 价格大幅上涨,但关键阻力区目前构成重大阻力,现货抛售压力迹象依然存在。成交量依然高企,看涨势头持续增强,表明即使在当前阻力位,买家兴趣依然强劲。

截至发稿时, Kaspa [KAS]在过去 24 小时内飙升了 13%,延续了稳步上涨的趋势,过去四周内价格上涨了 72%。

然而,尽管交易量上升且买盘积极,但随着价格走势测试历史上看跌的阻力区,这种看涨势头可能会停滞。

KAS 进入供应区,利空催化剂开始发挥作用

图表分析显示,KAS 已进入关键阻力区,也被确定为供应区。

该区域位于 0.114 美元至 0.127 美元之间,历史上曾引发强烈的价格拒绝。

例如,2 月份,当 KAS 短暂进入该区域时,导致其价格大幅下跌,创下今年的最低价。

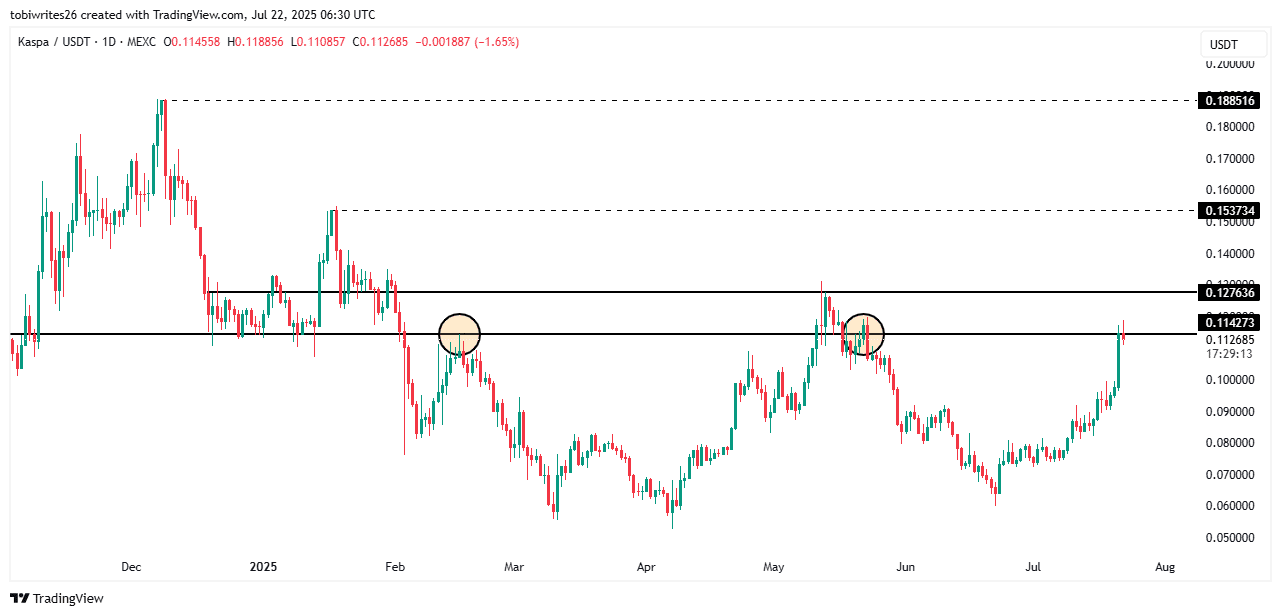
5 月份也出现了类似的下跌,当时 KAS 再次触及该区域,随后跌至 0.6 美元区间。

截至发稿时,KAS 已测试该阻力区,并遭遇轻微回调,K 线转为红色。虽然这尚未确认出现抛售,但反映出该水平存在显著的抛售压力。

买家可能仍然占上风

尽管面临阻力,但指标显示,随着购买活动的增加,卖家可能会遭受损失。

累积/分布(A/D)和牛熊力量(BBP)等关键指标表明看涨力量正在增强。

A/D线反映出强劲的增持势头,表明近期买盘多于卖盘。值得注意的是,过去24小时内增持量达到101.8亿KAS,呈上升趋势,并预示着未来仍有增长潜力。

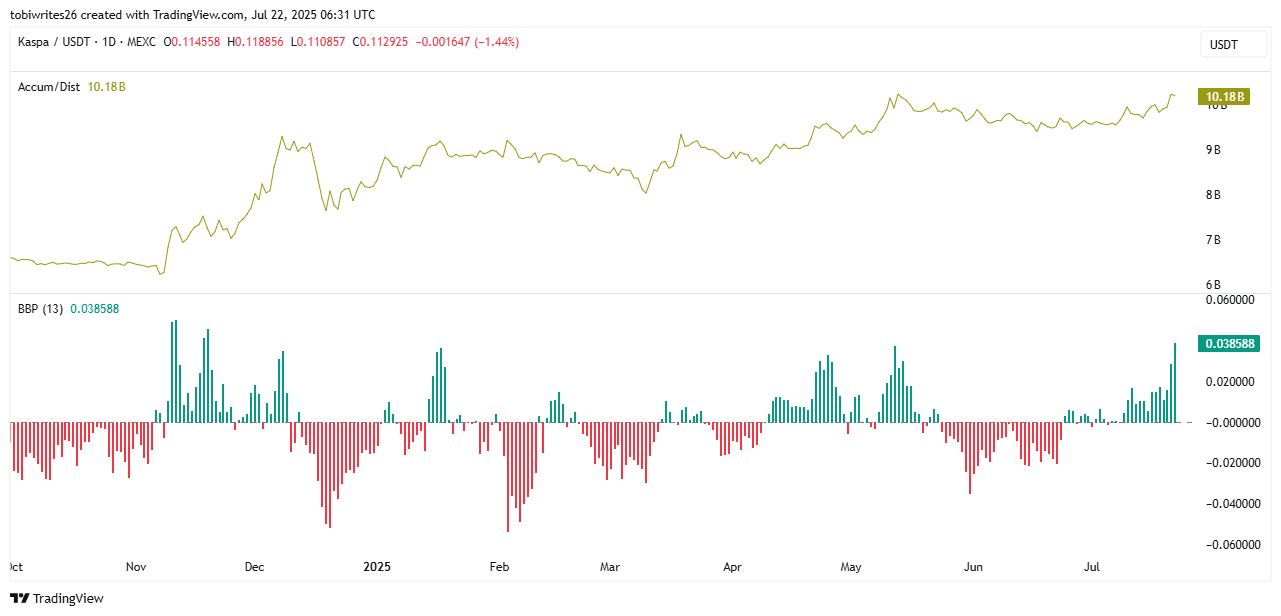
同样,BBP 也达到了两周以来的最高点,这表明多头开始以更大的兴趣主导市场。

这一趋势表明,尽管KAS的交易价格位于已知的供应区间,但多头正在积极介入。然而,该资产能否突破这一水平仍不确定。

现货贸易商恢复购买 KAS

在过去四天里,即使 KAS 上涨,现货交易员也一直在中心化交易所出售该代币。

根据CoinGlass的数据,这些交易员的累计销售额总计 148 万美元,反映出尽管价格上涨,但看跌情绪依然存在。

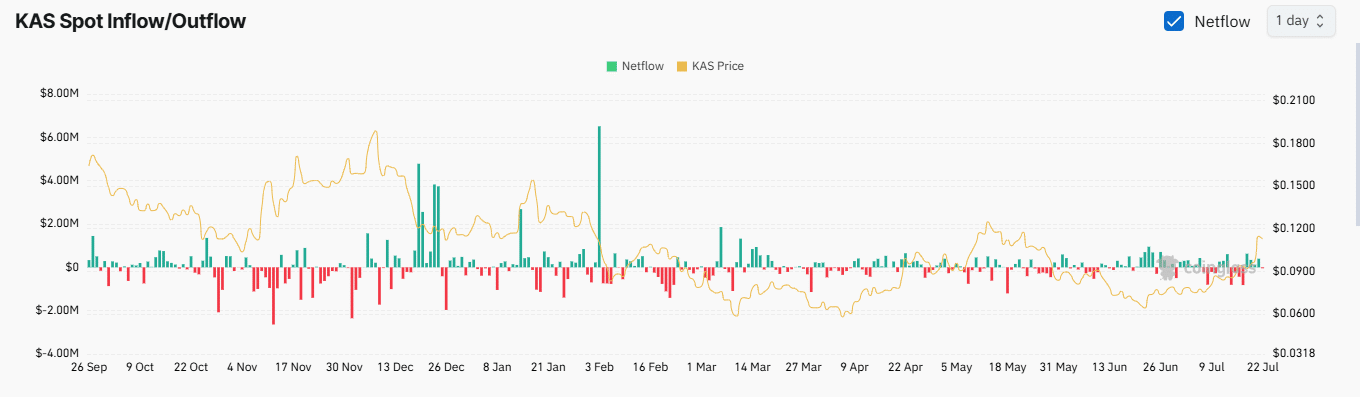
有趣的是,抛售压力已经放缓。过去24小时内,现货总成交量仅为4.7万美元,这表明购买兴趣重新燃起。

虽然这表明现货市场多头开始再次积累,但趋势并非完全看涨。空头仍有可能再次入场,施加下行压力,并引发KAS价格回调。

Letture associate

Rented Faith: How Much of the Bitcoin ETF Inflows Is Real Money?

"Rented Conviction: How Much of Bitcoin ETF Flows Is Real Money" The weekly inflows into Bitcoin ETFs are often interpreted as a gauge of institutional belief. However, a significant portion of this activity is driven by a hidden arbitrage trade, not directional conviction. The core mechanism is a cash-and-carry arbitrage: traders buy spot Bitcoin (often via ETFs) while simultaneously shorting CME futures to lock in the price difference, or "basis." This delta-neutral trade is essentially an interest rate play. In weekly data, about half the fluctuation in ETF flows can be explained by new short positions added by leveraged funds (hedge funds), with a correlation of 0.70. Bitcoin's price movement in a given week shows no statistical power in predicting these flows. While this arbitrage trade drives weekly *volatility*, it is not the main component of the cumulative *stock*. Of the total ~$55 billion in net ETF inflows, the current net arbitrage position is only about $1 billion. The remainder is steady, directional buying averaging ~$400 million per week, which constitutes the vast majority of the accumulated "mountain" over two years. Thus, ETF flow data overstates the *volatility* of conviction, not its *level*. This arbitrage trade has been unwinding for nearly two years. Leveraged fund short positions peaked at ~$14 billion in late 2024 and have since declined to ~$4.5 billion. When the basis compresses to unprofitable levels, ETF inflows and short positions retreat together. Recent outflows should not be mistaken for a loss of faith but rather the routine unwinding of this rate trade. For Ethereum ETFs, the pattern is weaker. Accounting for staking yield makes the basis often negative, so neither strong conviction buying nor robust arbitrage supports its flows. To interpret ETF flows correctly, monitor the CME basis versus T-bill rates and leveraged fund net shorts. They reveal how much of the next "demand" headline is real. The real, patient buy-and-hold demand is what constitutes the enduring bulk of ETF assets.

marsbit45 min fa

Rented Faith: How Much of the Bitcoin ETF Inflows Is Real Money?

marsbit45 min fa

Soaring Over Tenfold Within the Year: The Frenzy Over SK Hynix Leveraged Products

South China Morning Post The leveraged ETF tracking SK Hynix has surged over tenfold year-to-date, fueled by intense market speculation on the memory chip sector. By June 22, the value of the 'South Korea 2x Long SK Hynix ETF' listed in Hong Kong had skyrocketed by more than 1,061% since the start of the year, while its asset size exploded over twenty times from the end of last year. The rally is driven by AI-driven demand for high-bandwidth memory (HBM), with SK Hynix recently sampling its next-generation HBM4E product. However, industry professionals warn of significant risks. Leveraged ETFs magnify both gains and losses. During a recent market correction, while the underlying SK Hynix stock fell 19.1%, its double-leveraged ETF dropped nearly 38%. Korean regulators noted that such products could theoretically lose 60% in a single day. Additionally, these ETFs face risks like time decay in volatile markets, liquidity spirals during mass redemptions, and extreme price dislocations from market-making failures, as seen in early June when an ETF moved opposite to its underlying stock. The trading is predominantly driven by retail investors, with institutional capital largely absent due to the products' high volatility. Analysts caution that with the semiconductor sector at elevated valuations and facing geopolitical and supply chain uncertainties, leveraged ETFs pose a substantial threat of amplified losses for uninformed investors.

marsbit1 h fa

Soaring Over Tenfold Within the Year: The Frenzy Over SK Hynix Leveraged Products

marsbit1 h fa

18 Months, Over 50x Surge: KIOXIA's Epic Comeback

KIOXIA, a NAND flash memory giant, staged a dramatic comeback driven by AI demand. After a period of significant losses, a failed merger, and missed HBM opportunities, its 2024 IPO began modestly. However, fueled by explosive demand for AI data storage, its stock price skyrocketed over 50 times within 18 months, making it Japan's most valuable company, surpassing Toyota. Its Q1 FY2026 profit guidance soared 30-fold year-over-year, with 2026 NAND capacity already sold out. Key to its success is its 3D NAND technology, BiCS FLASH. As the inventor of NAND, KIOXIA advanced its technology through generations, reaching over 200 layers by 2023. Key innovations include CBA (CMOS directly Bonded to Array), which separately manufactures control circuits and memory arrays for better performance, and OPS (On Pitch Select Gate) to increase density. The company is now developing high-capacity packages like an 8TB solution stacking 32 dies. Looking beyond NAND, KIOXIA is exploring 3D DRAM with its OCTRAM technology, using oxide semiconductor transistors for ultra-low leakage to reduce power consumption. This fundamental research differs from HBM and represents a long-term bet to extend its 3D expertise from NAND into future DRAM architectures. KIOXIA's story highlights how technological assets and shifting market cycles can rapidly transform a company's fortunes. While questions remain about sustaining growth beyond the current AI boom, its resurgence demonstrates that in semiconductors, being down does not necessarily mean being out.

marsbit1 h fa

18 Months, Over 50x Surge: KIOXIA's Epic Comeback

marsbit1 h fa

Trading

Spot
Futures
活动图片