Rippling Away

insights.glassnodePubblicato 2025-04-01Pubblicato ultima volta 2025-04-02

Executive Summary

  • The Bitcoin market continues to consolidate within the $76k to $87k range, with the Realized Profit/Loss Ratio starting to show signs of near-term seller exhaustion but not yet a renewal of sustained bullish momentum.
  • A longer-term view reveals a deterioration of investor profitability, and an on-chain ‘Death-Cross’ has occurred, suggesting the market may remain weak for the foreseeable future.
  • Supply in loss remains elevated at 4.7M BTC, while the behavior of coins held in-loss is signalling moderate investor stress. Together, these metrics build a picture of deepening bearish conditions.
  • Ripple’s XRP network recently experienced a +490% spike in address activity and a near-doubling of Realized Cap, signalling aggressive retail interest. However, profitability has rapidly faded, suggesting retail interest may be increasingly fragile.
💡
View all charts in this edition in The Week On-chain Dashboard.

Short-Term Relief

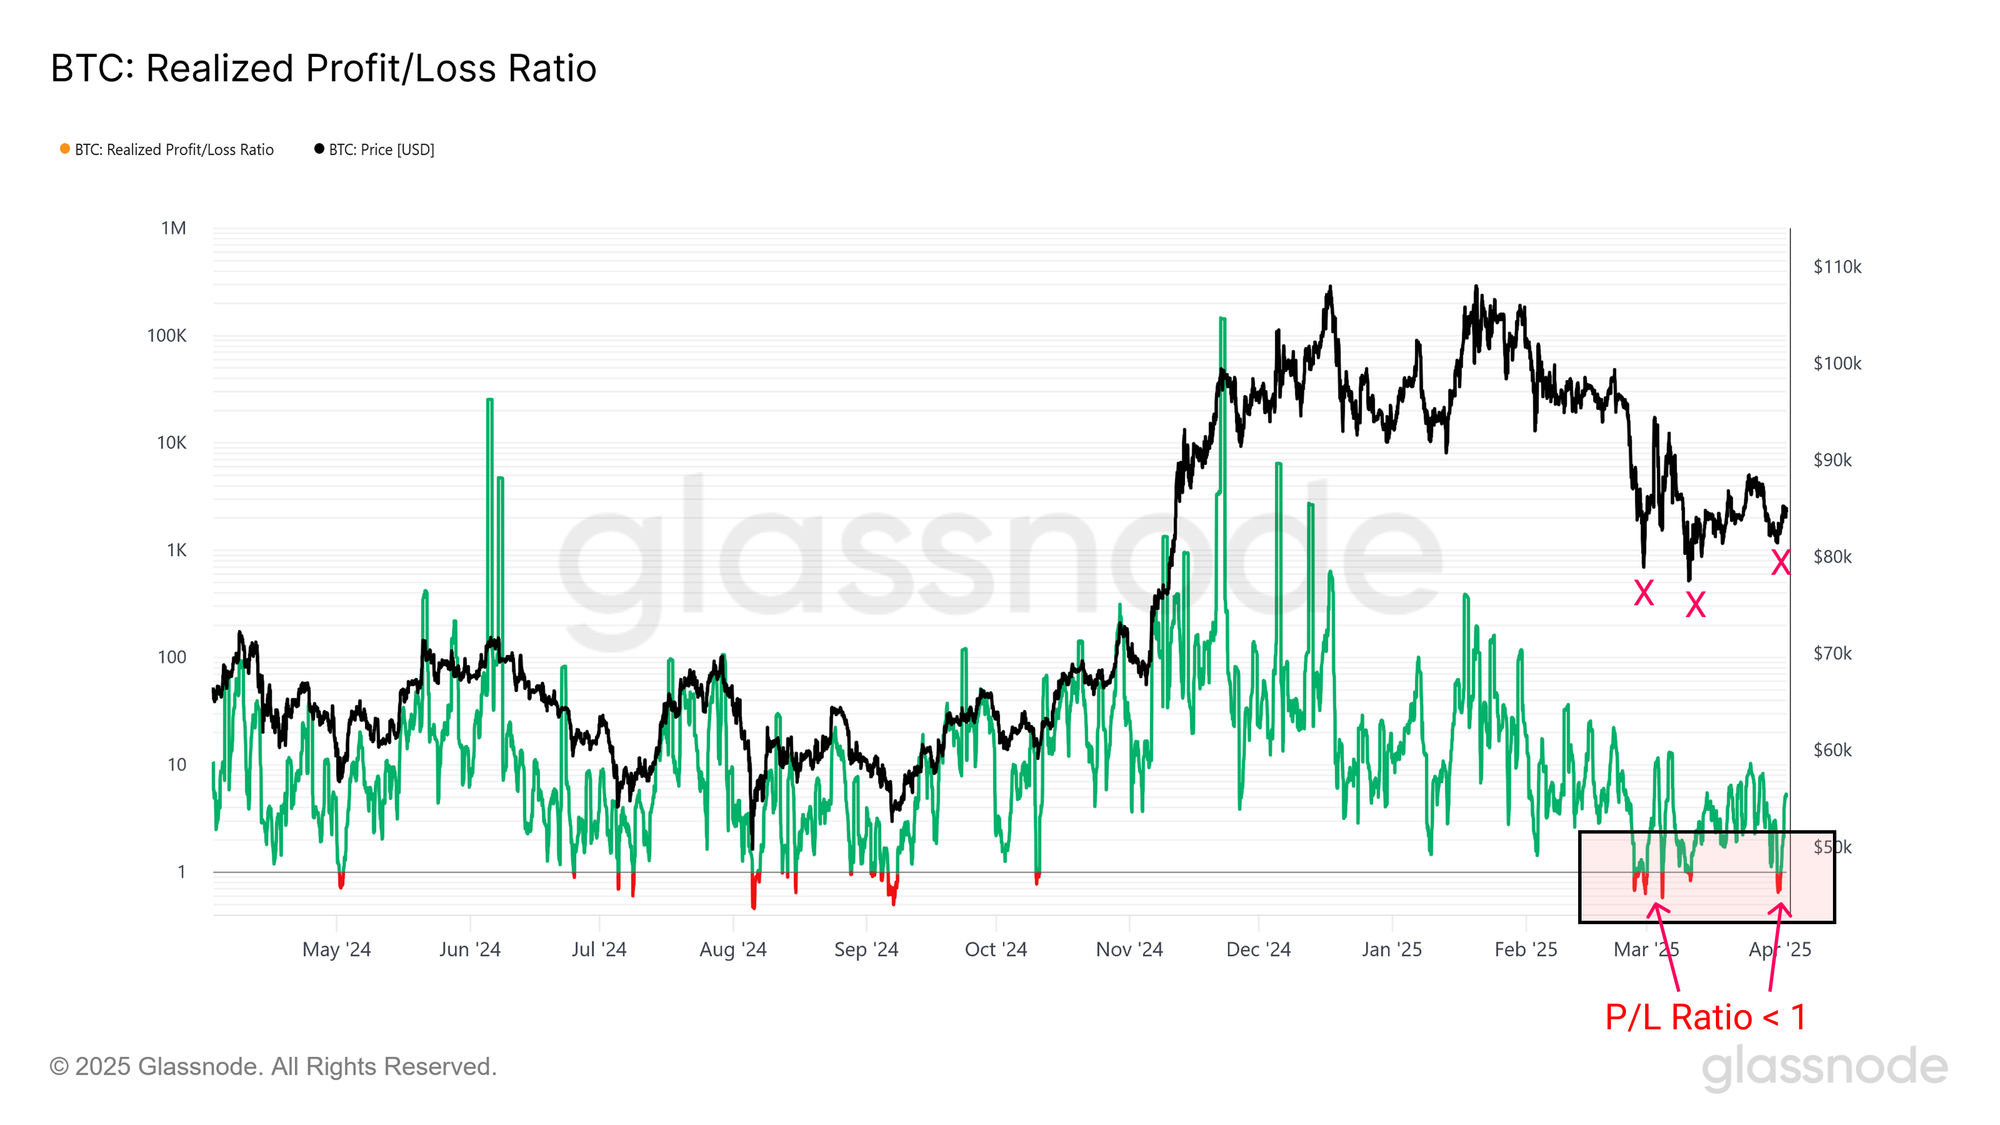
Recent weeks in digital asset markets have been defined by a steady downtrend, with Bitcoin prices trading -30% below the ATH. During this correction, the $76k to $85k zone has emerged as a critical area of interest, with the market trading in this range since late February. Each sell-off towards the range lows has been met with a swift recovery, suggesting the presence of strong reactive demand has shown up whenever prices trade below $80k.

To better understand these dynamics, we turn to the Realized Profit/Loss Ratio — a metric that compares the USD volume of realized profits versus losses. When this ratio falls below 1.0, it signals that more capital is being locked in a loss than a profit. These retests of the 1.0 level often coincide with local capitulation events and short-term price reversals.

Most notably, each dip into the $76k to $80k range has coincided with a P/L Ratio dipping below 1.0, highlighting episodes where losses outweighed profits. This imbalance typically marks a degree of seller exhaustion, where downside momentum fades as sell-side pressure is absorbed.

The resulting rebound appears as relief rallies, but we have not yet seen signs of renewed and sustained strength, reflecting a market which is still processing the emotional and financial hangover of the $109k ATH peak.
Live Chart

Zooming Out

Although short-term seller exhaustion can provide momentary relief, a deeper question emerges: Are these rebounds signs of a larger bullish impulse, or simply reactive bounces within a broader downtrend?

While some market participants may speculate that repeated bounce-backs from the $76k–$80k range could eventually rally toward new all-time highs, a longer-term perspective is necessary to gauge the sustainability of such momentum.

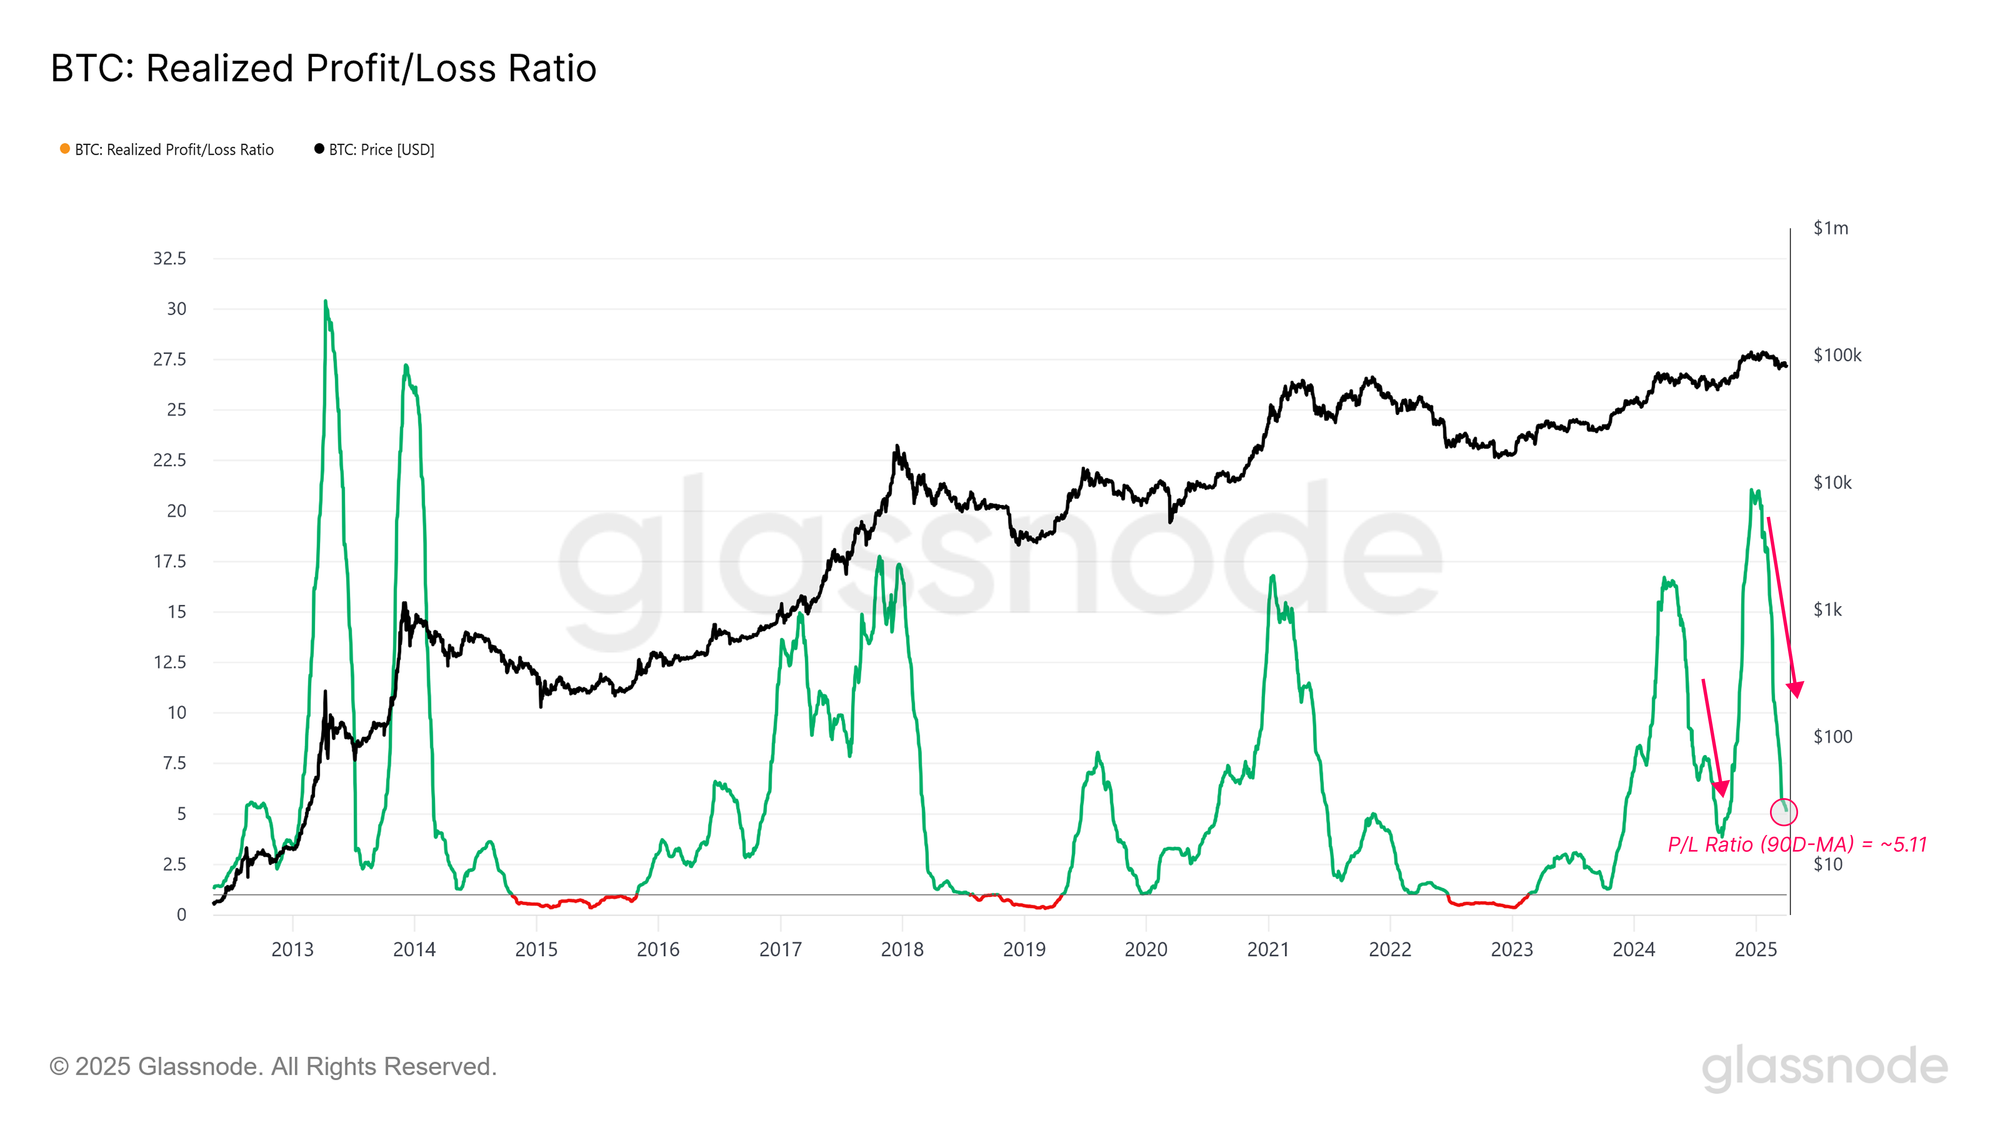
The Realized Profit/Loss Ratio, is traditionally shown in logarithmic scale due to its volatility and wide range. To provide a clearer view of broader market dynamics, we have plotted a 90-day simple moving average to the metric on a linear scale. This smoothed presentation helps filter out the daily noise and highlights prevailing trends in spending profitability.

From this vantage point, the longer-term momentum has declined markedly since early January, despite the recent short-term spikes seen on the raw daily resolution. These brief profit-driven surges have failed to reverse the broader downtrend, suggesting that the macro picture remains one of generally weaker liquidity and deteriorating investor profitability.

So far, there is little evidence suggesting a structural bullish shift in momentum is underway.
Live Chart

An On-Chain Death Cross

With profitability trending lower, it’s logical to turn our attention to price momentum as a core driver behind investors locking in both profit and loss.

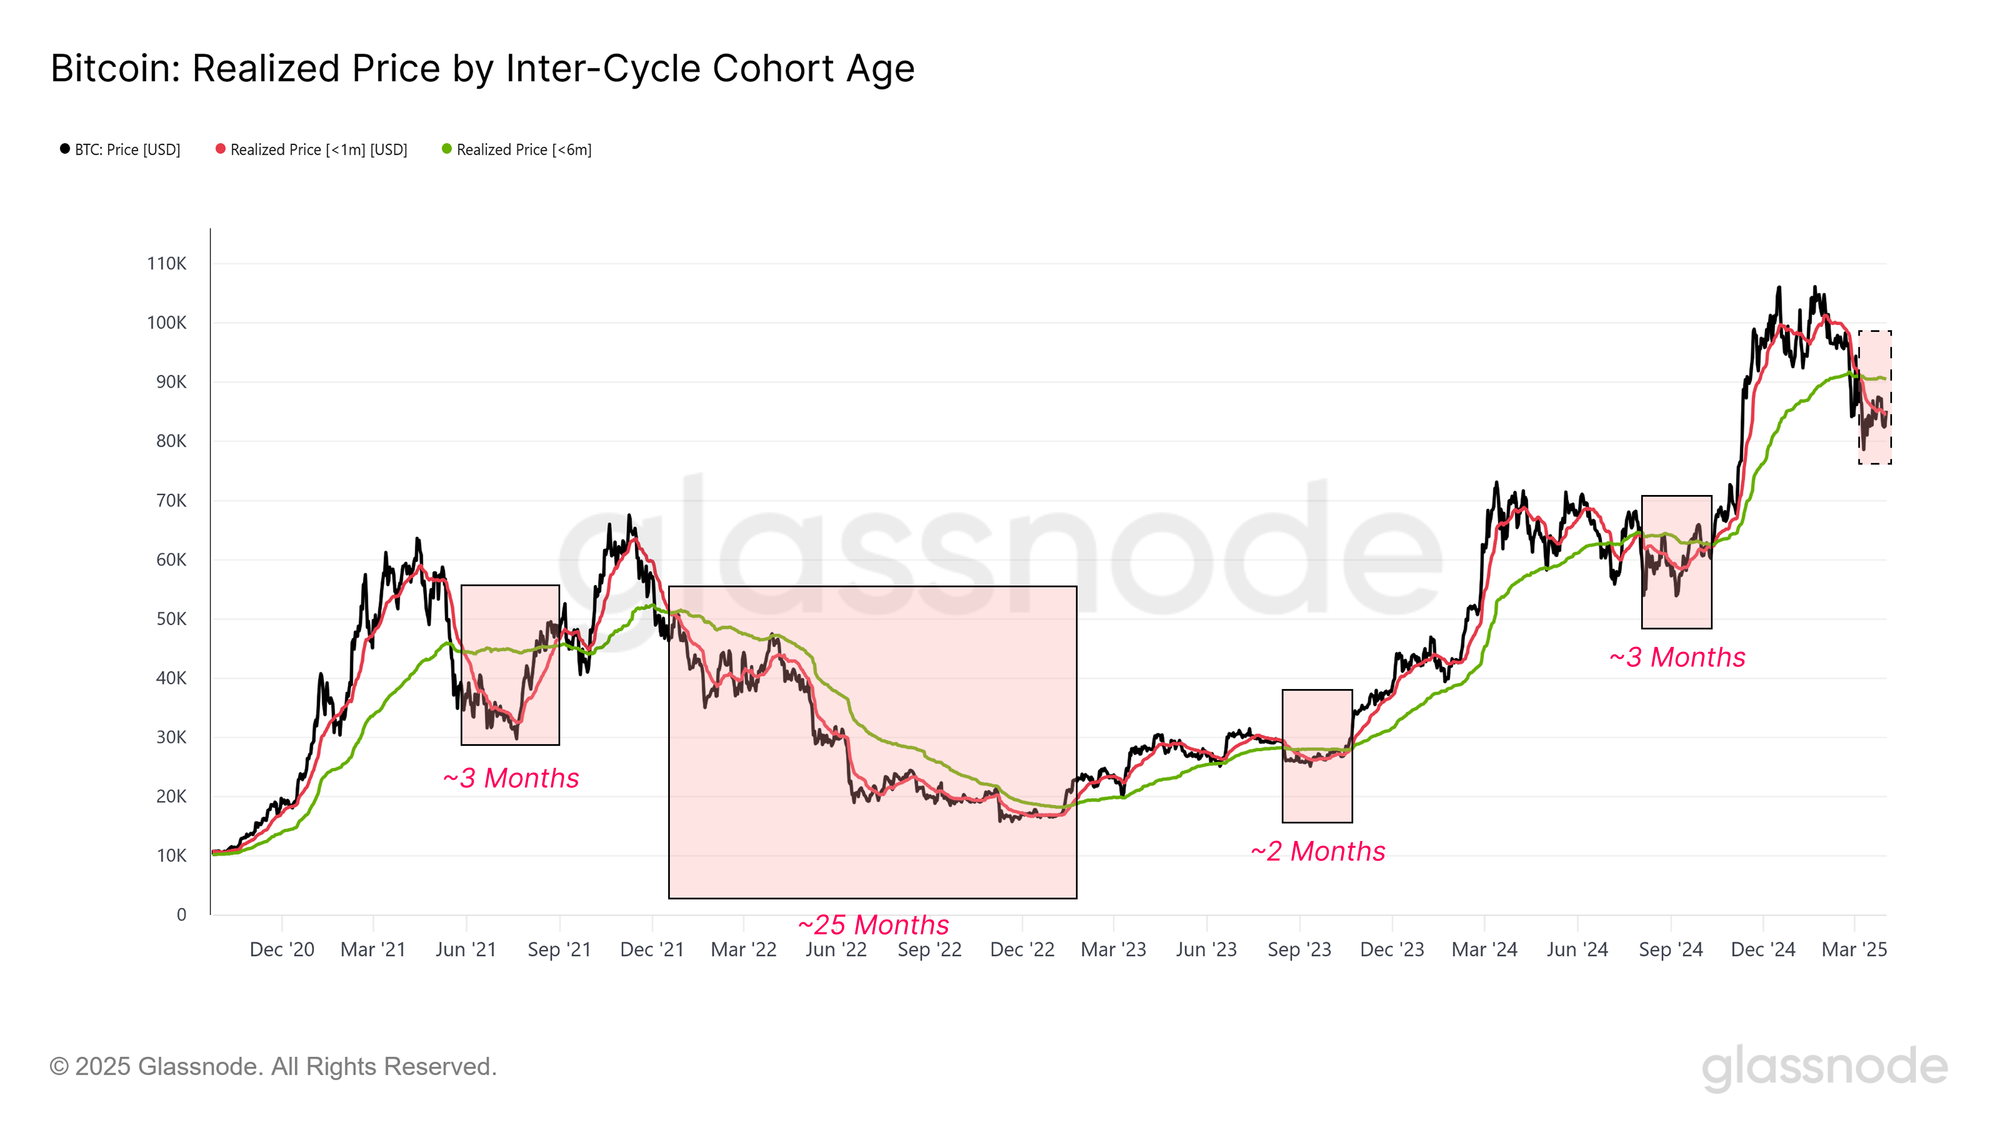
Traditionally, technical analysts identify major shifts in momentum when a “Death Cross” occurs, indicating where the 50-day moving average drops below the 200-day. This event often signals a weakening trend.

To bring this concept into the on-chain domain, we construct an analogue using on-chain volume-weighted prices for coins moved in the last 1 month, compared to the last 6 months. This method directly reflects market sentiment by factoring in both when and how much capital actually moves on-chain.

The recent crossover of the short-term 1-month average below the long-term 6-month price could be considered to mark an on-chain Death Cross. This pattern has historically preceded 3–6 month-long bearish trends. If this cycle follows suit, it suggests the market may still be working through a period of weakness before the bulls can reestablish a robust uptrend.
Live Chart

Bear Market Depth

Following signs of weakening momentum and shrinking profitability, the current market structure ticks nearly many of the boxes we look at for a typical bear market phase. The current market is characterized by tighter liquidity conditions, negative sentiment and momentum, and investor behaviour increasingly moving toward loss-taking events.

In such environments, investor psychology is dominated by fear and emotional fatigue. Historically, the most extreme bearish phases tend to culminate with a capitulation event, often setting the stage for bottom formation and an eventual recovery.

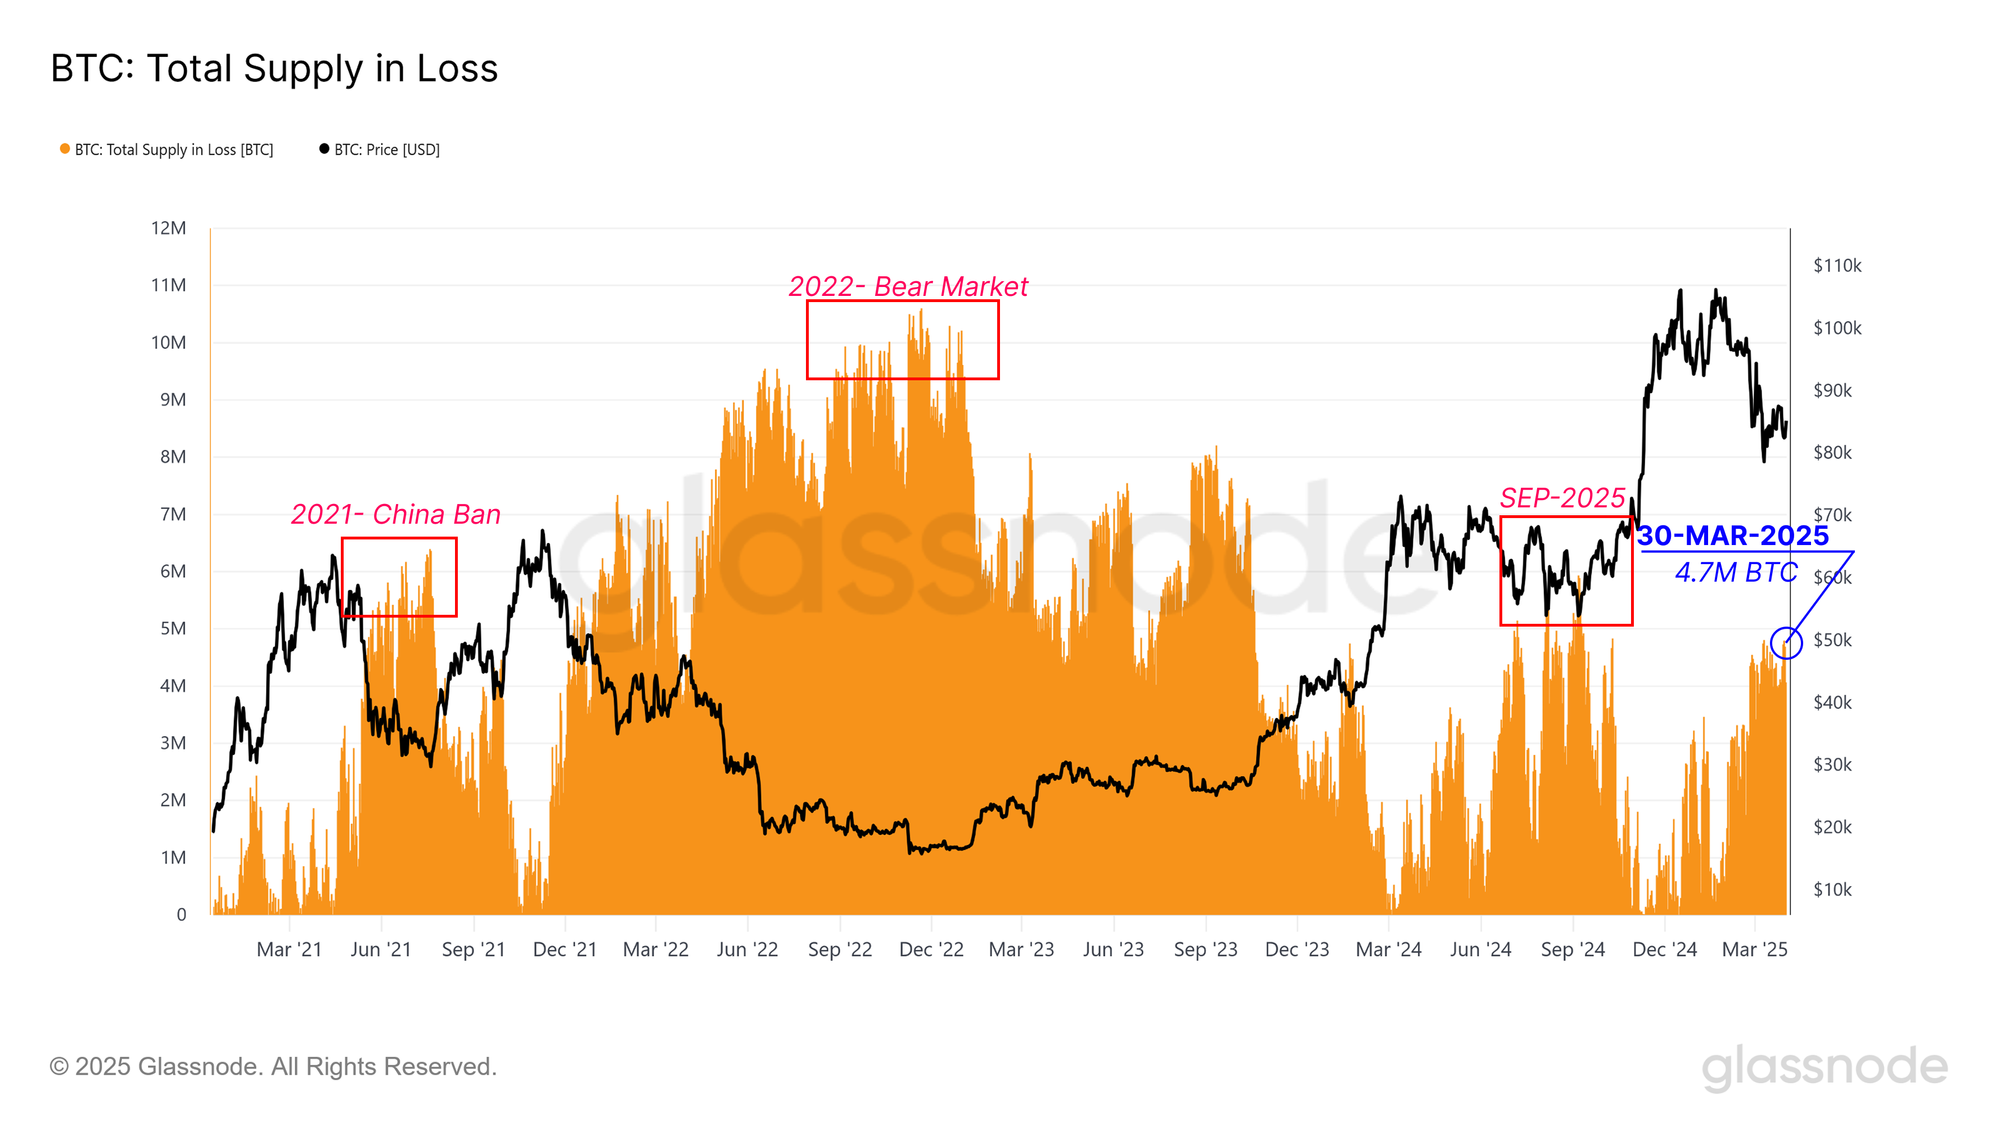
A comprehensive analysis of bearish markets involves two key dimensions: loss dominance and loss intensity. Loss dominance is captured by the Total Supply held in Loss, which tracks the volume of coins held below their on-chain acquisition price. On March 30, 4.7M BTC were held below their cost basis, which is an elevated level, though still below extremes seen in mid-2021, the 2022 bear market, and during the September 2024 drawdown.

Sizing up these losses helps frame where we are in the cycle and whether the market is deep in despair, nearing exhaustion, or may still have more pain to endure.
Live Chart

Measuring Loss Intensity

Building on our view of loss dominance, the second dimension of investor stress is loss intensity, which captures how far below the cost basis investor holdings are. To assess this, we turn to the Market Value to Realized Value (MVRV) ratio, a metric that compares the spot price to the average cost basis of all coins in the supply.

To isolate the experience of underwater investors, we can focus specifically on the MVRV of supply held in loss. We can construct this metric by dividing the total USD-denominated unrealized loss held by the market by the number of coins contributing to it.

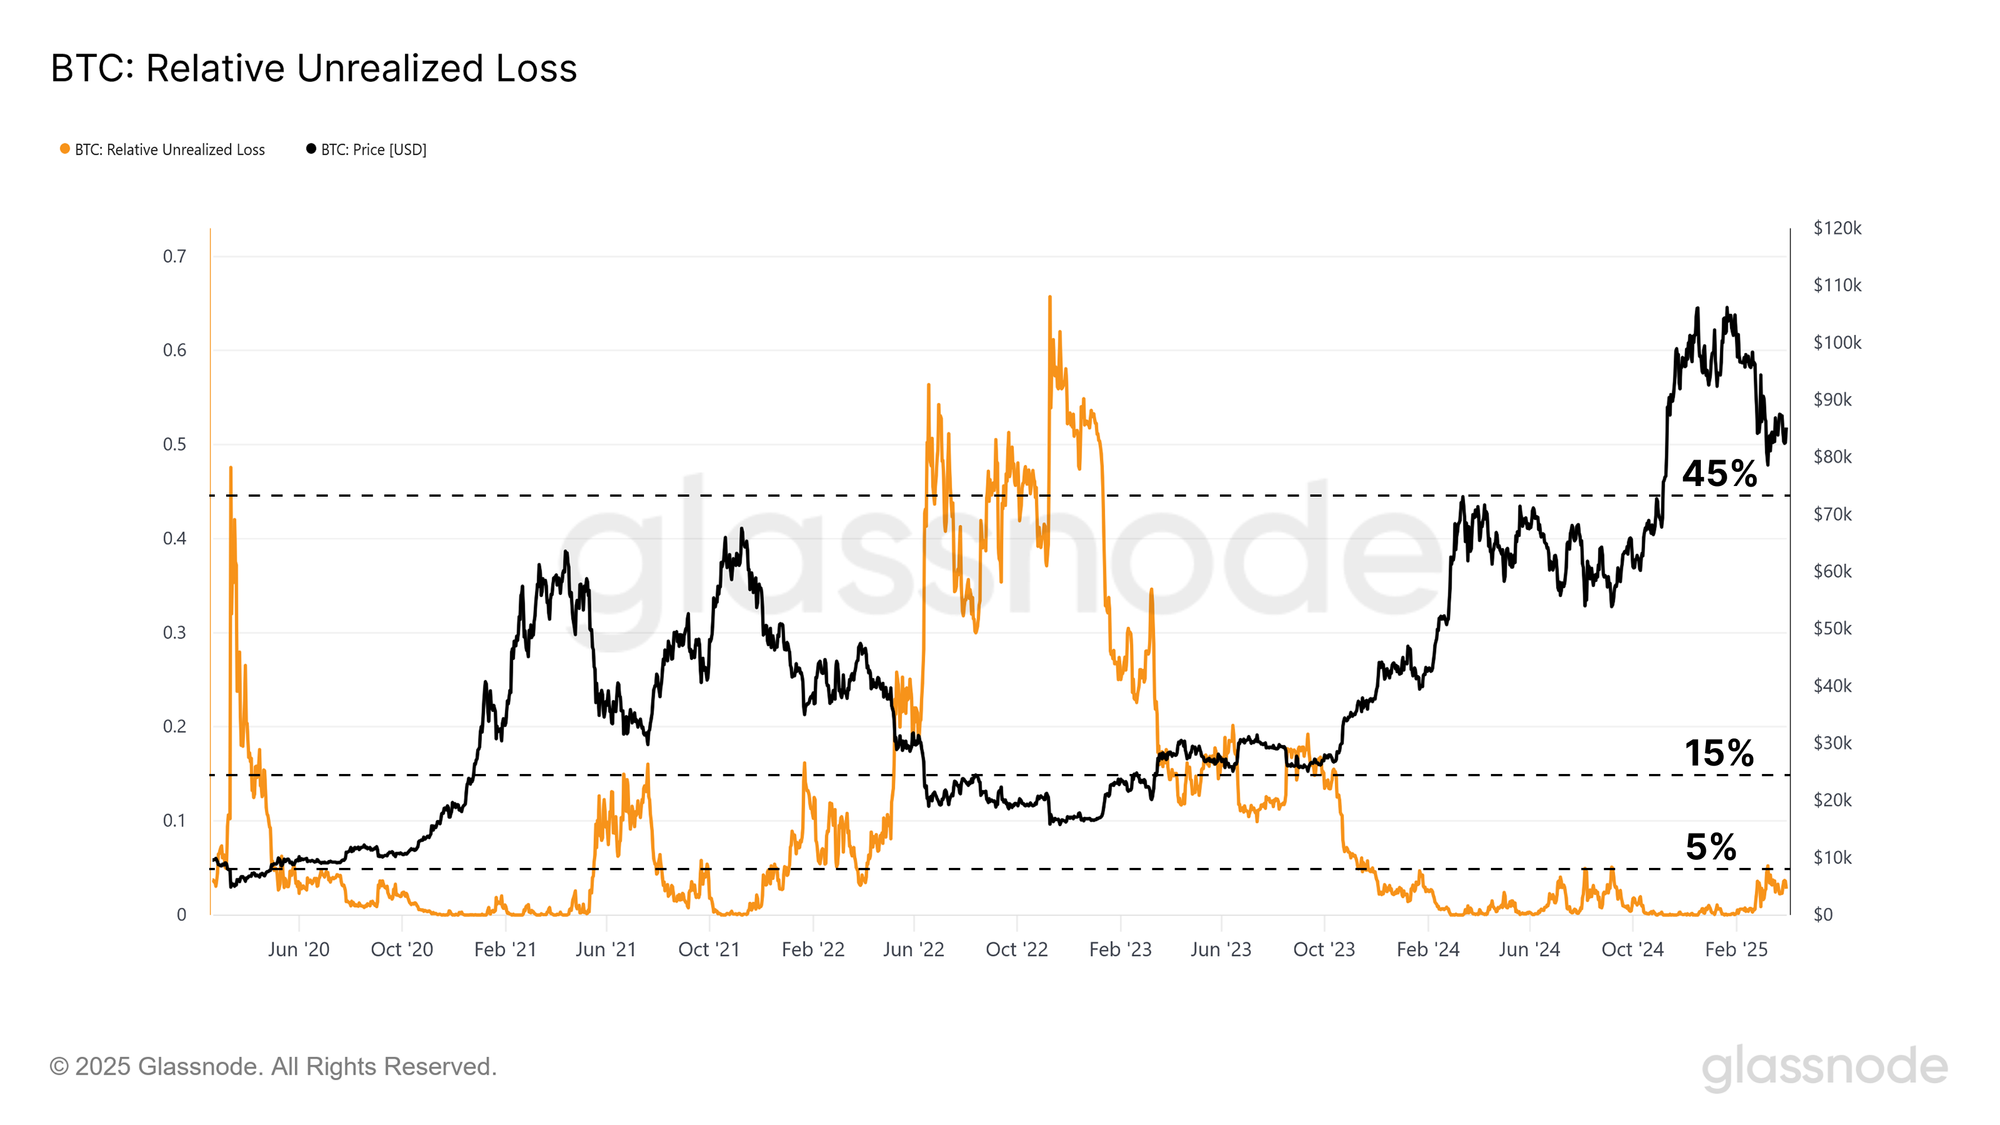
The Relative unrealized loss, which expresses the proportion of the market cap that is underwater, is currently at 2%. This is notably lower in magnitude than what we have seen in previous bear markets, such as in 2022. By this measure, whilst the number of coins held in loss is substantial, the magnitude of the unrealized losses they carry is not.
Live Chart

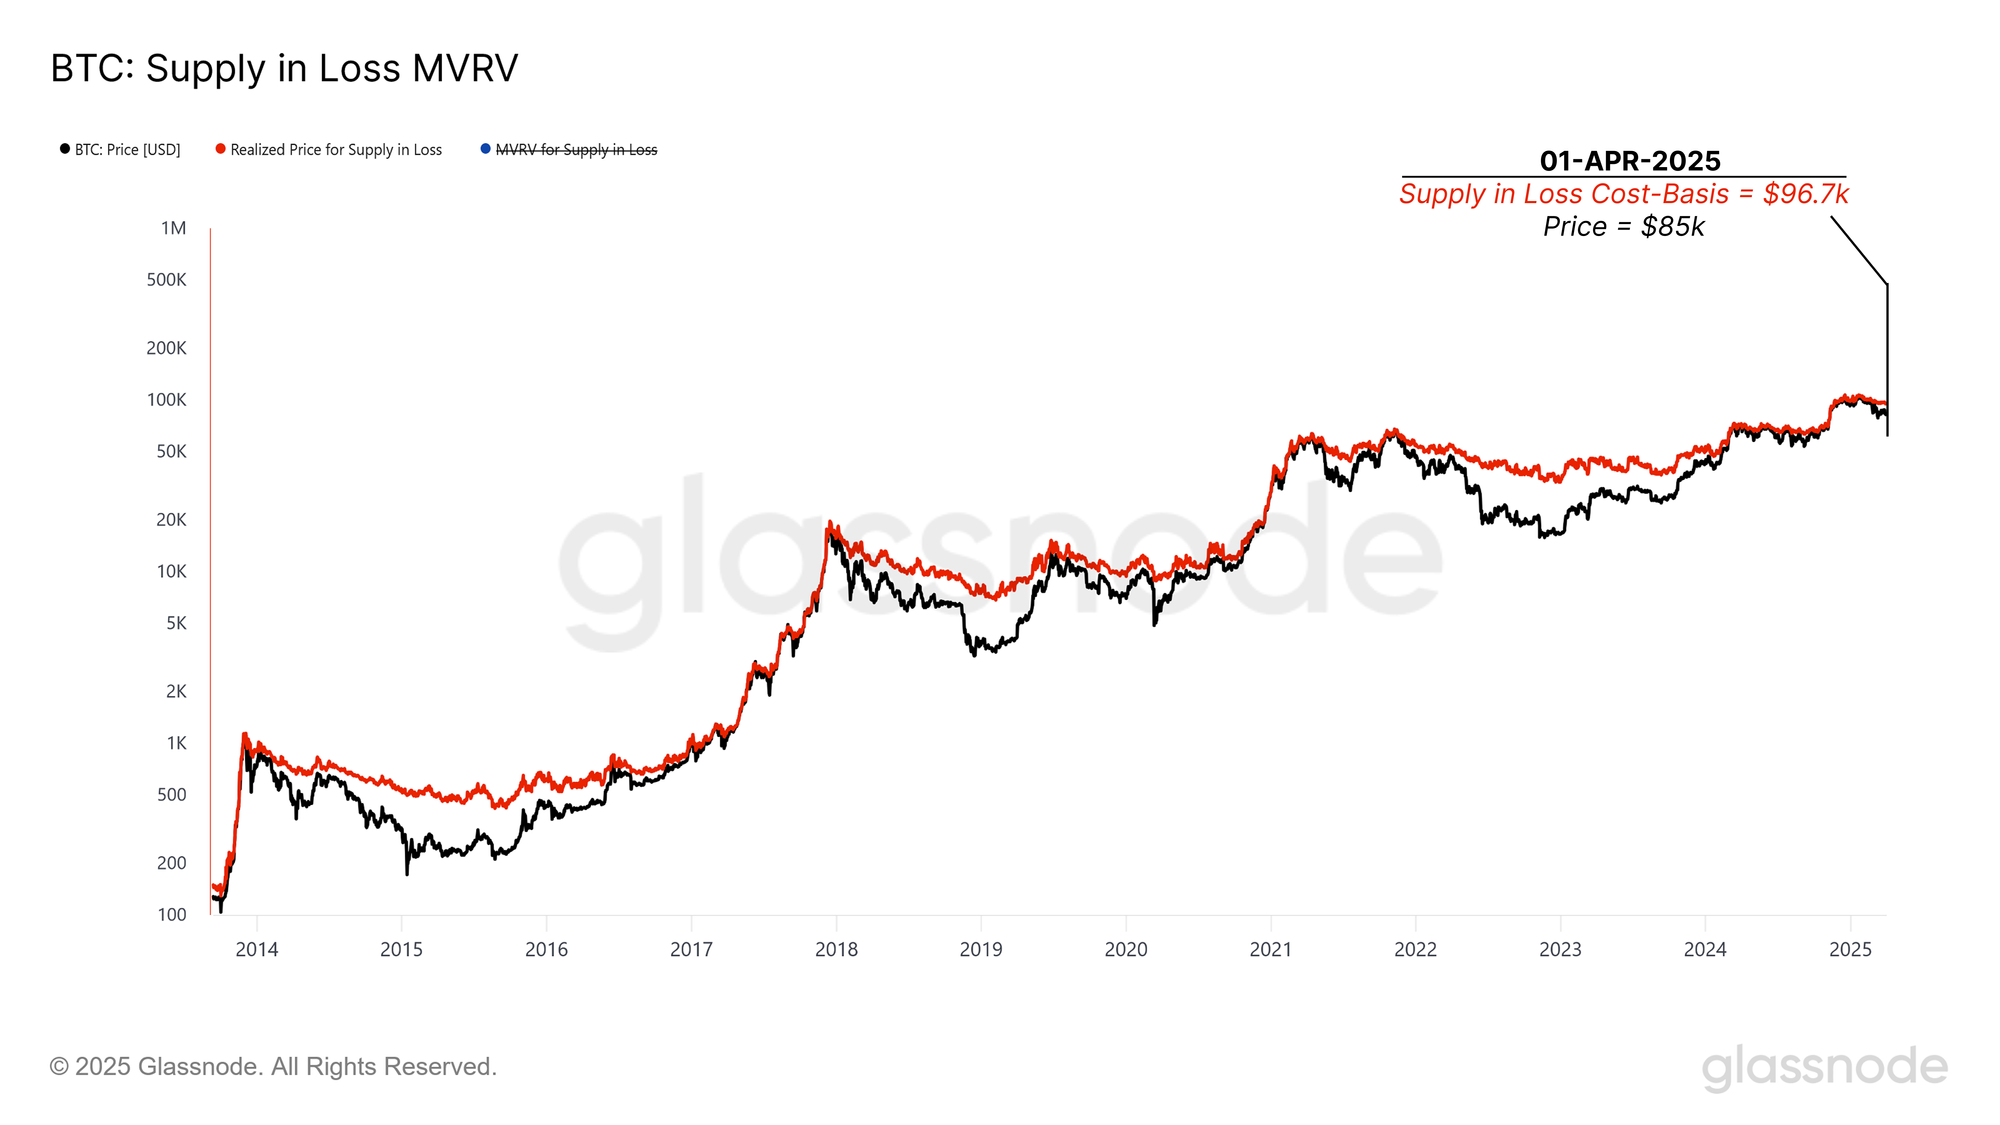
From this, we can compute the average cost basis of coins in loss using the following formula:

The realized price for the supply in loss is at $96.7k, which means, on average, the average underwater coin is holding an unrealized loss of -12%.
Live Chart

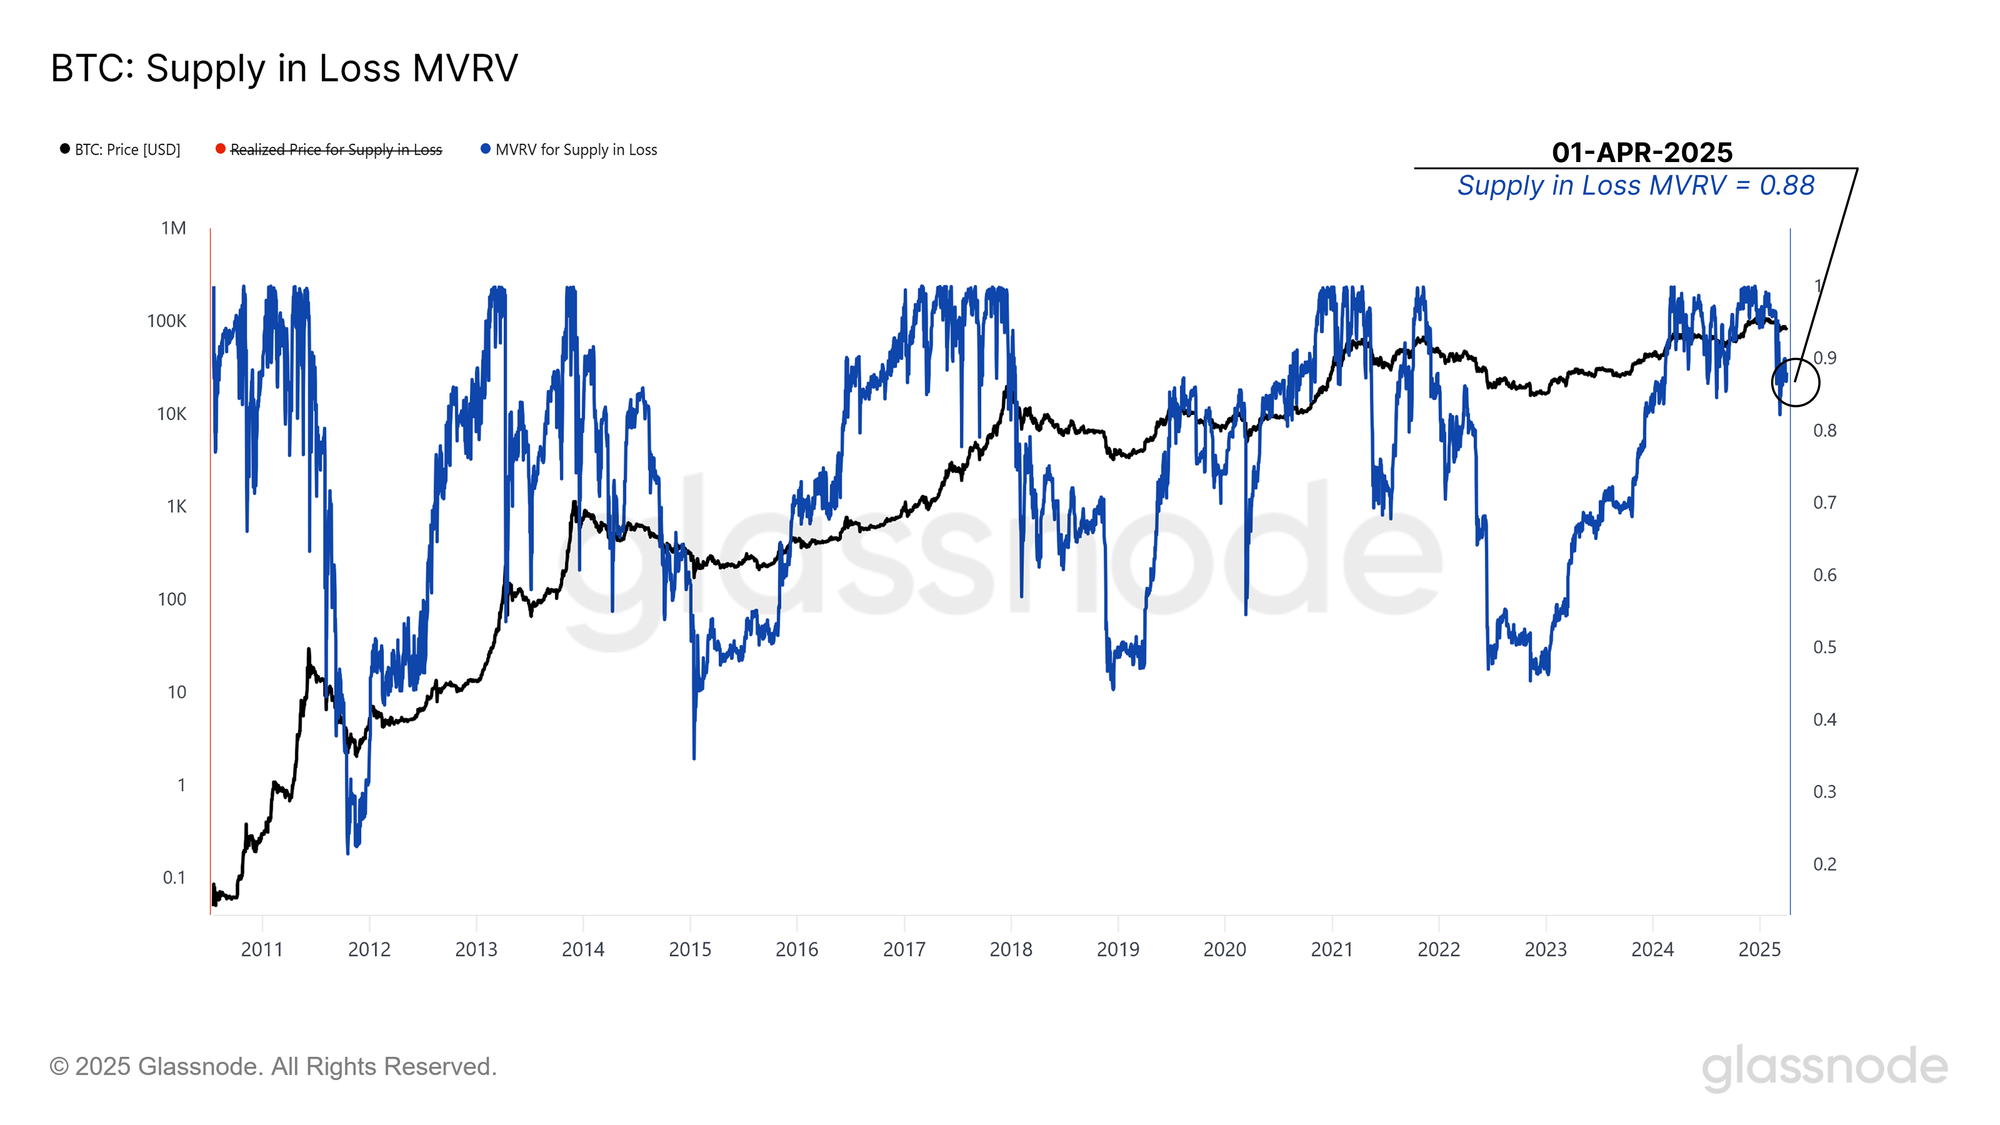
This Supply in-Loss Realized Price then serves as the denominator for constructing an MVRV ratio for these coins, creating an oscillator to compare how far underwater the average loss-holding investors are. We can then use this metric to compare across previous cycles and use this as an input for identifying how deep the investor distress is and whether there are any early signs of recovery.

The Supply in-Loss MVRV dropped sharply when the price broke below $93k and is now trading at 0.88, indicating a moderate degree of loss and stress within the market. This is one of the lowest levels of this MVRV for this cycle, although it is again not at the deeply low levels seen in prior bear markets.

Overall, there are many signs of weakness for Bitcoin investors. However, we should note that the magnitude of this weakness across several dimensions is not yet at the depth and severity of some of the more brutal downtrends Bitcoin has experienced in the past.
Live Chart

Rippling Away

As Bitcoin investors grapple with deepening losses, a contrasting trend emerges in more retail-driven corners of the market. One defining feature of this cycle has been the rise of institutional demand via U.S. spot ETFs, with a lot of retail participation and speculation pulled toward alternative digital assets.

For this cycle in particular, Ripple (XRP) has been a preferred asset for trade amongst retail investors, and studying its behavior can therefore serve as a proxy for measuring retail speculative demand.

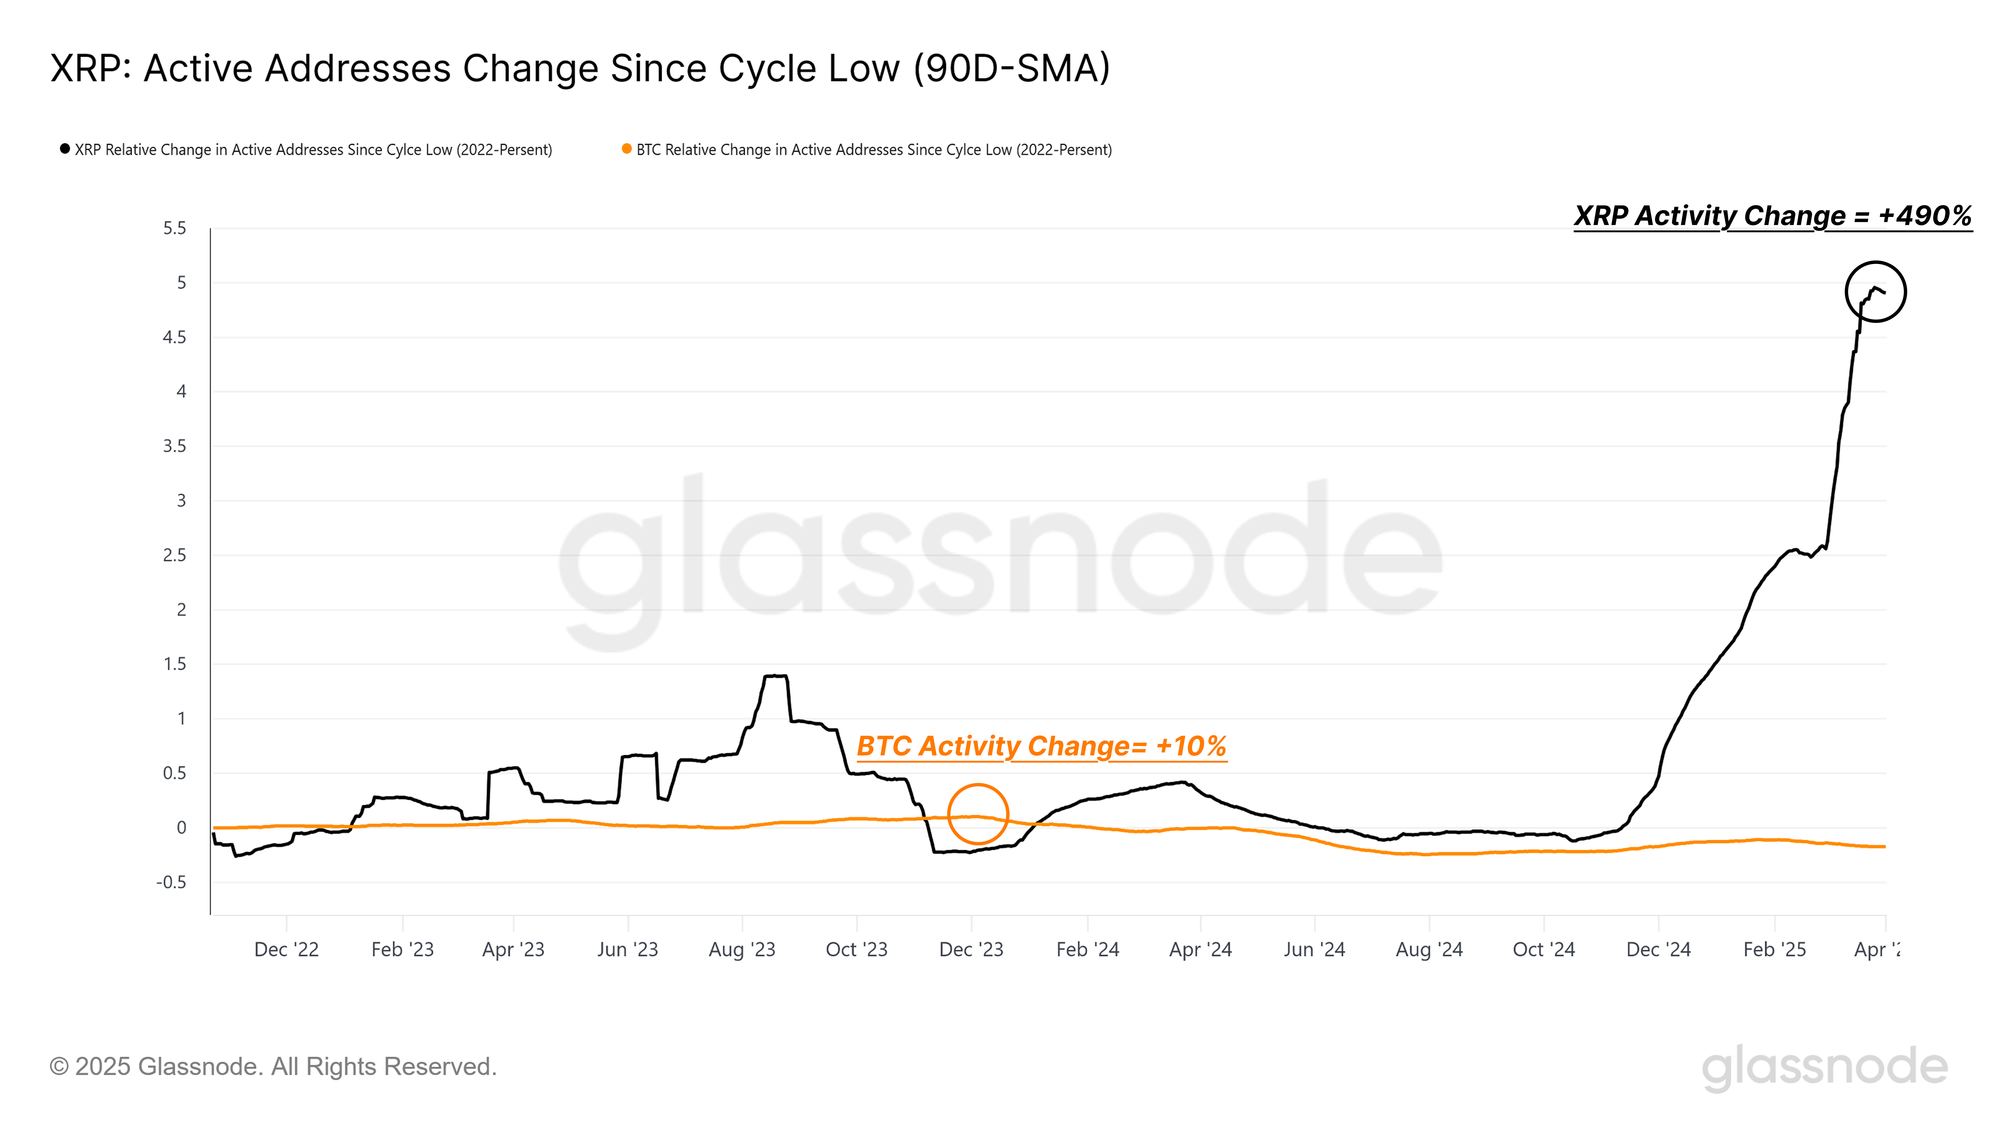
Since the 2022 cycle low, the quarterly average of daily active addresses for XRP has jumped by +490%, compared to just 10% for Bitcoin. This stark contrast suggests that retail enthusiasm has been attracted by XRP, thus providing a mirror for speculative appetite in the crypto space.
Live Chart

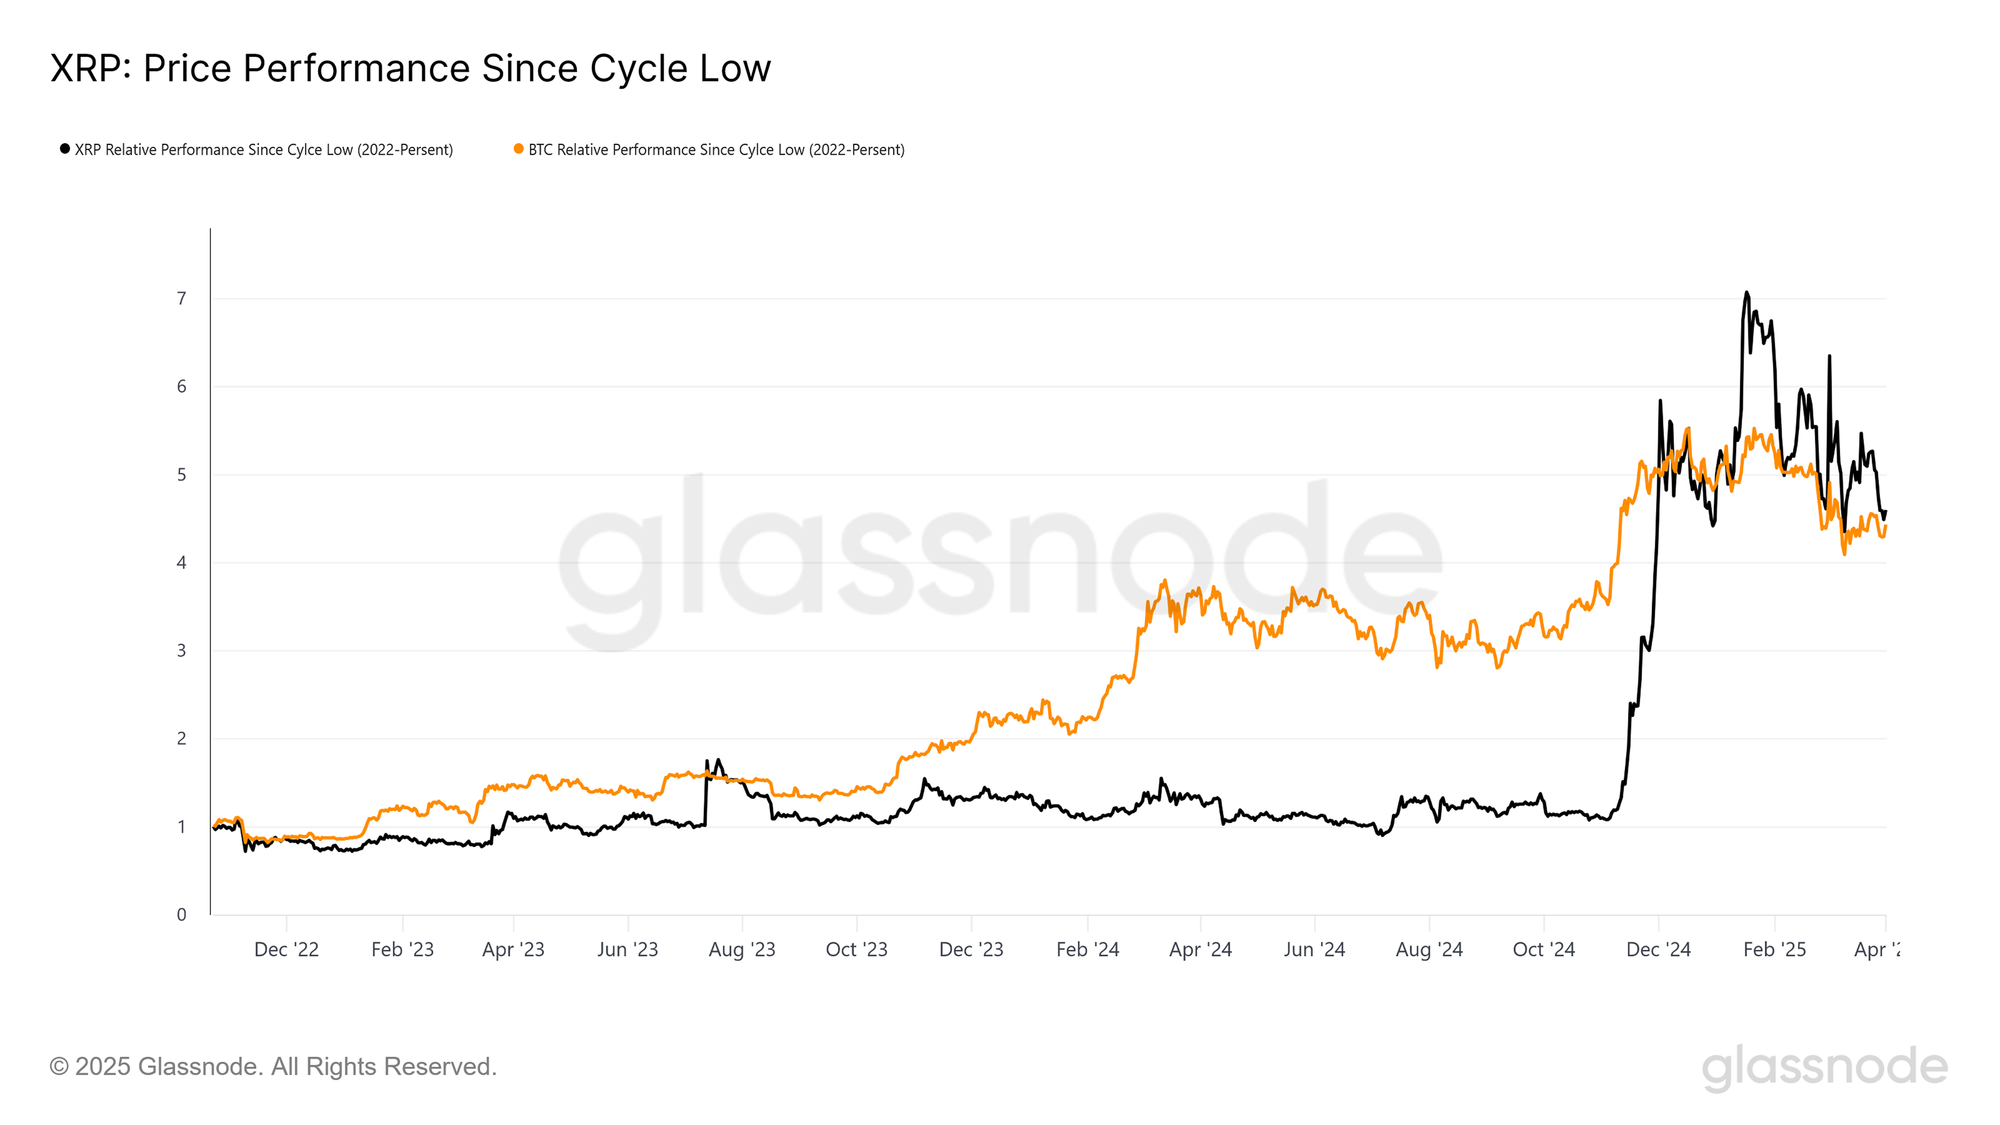
This becomes even clearer when we examine the path each asset has taken since the 2022 cycle low. While both Bitcoin and XRP have delivered a similar performance, both trading, roughly 5x to 6x off the bottom, the journey has been fundamentally different.

Bitcoin’s rally has followed a more organic and progressive trajectory, marked by steady growth and punctuated by sharp uptrends during key catalysts such as the launch of spot ETFs and developments around the U.S. elections.

In contrast, XRP traded largely sideways until December 2024 before experiencing an explosive surge higher, a price pattern more consistent with retail-driven speculation than with structured and sustained inflow of new demand.
Live Chart

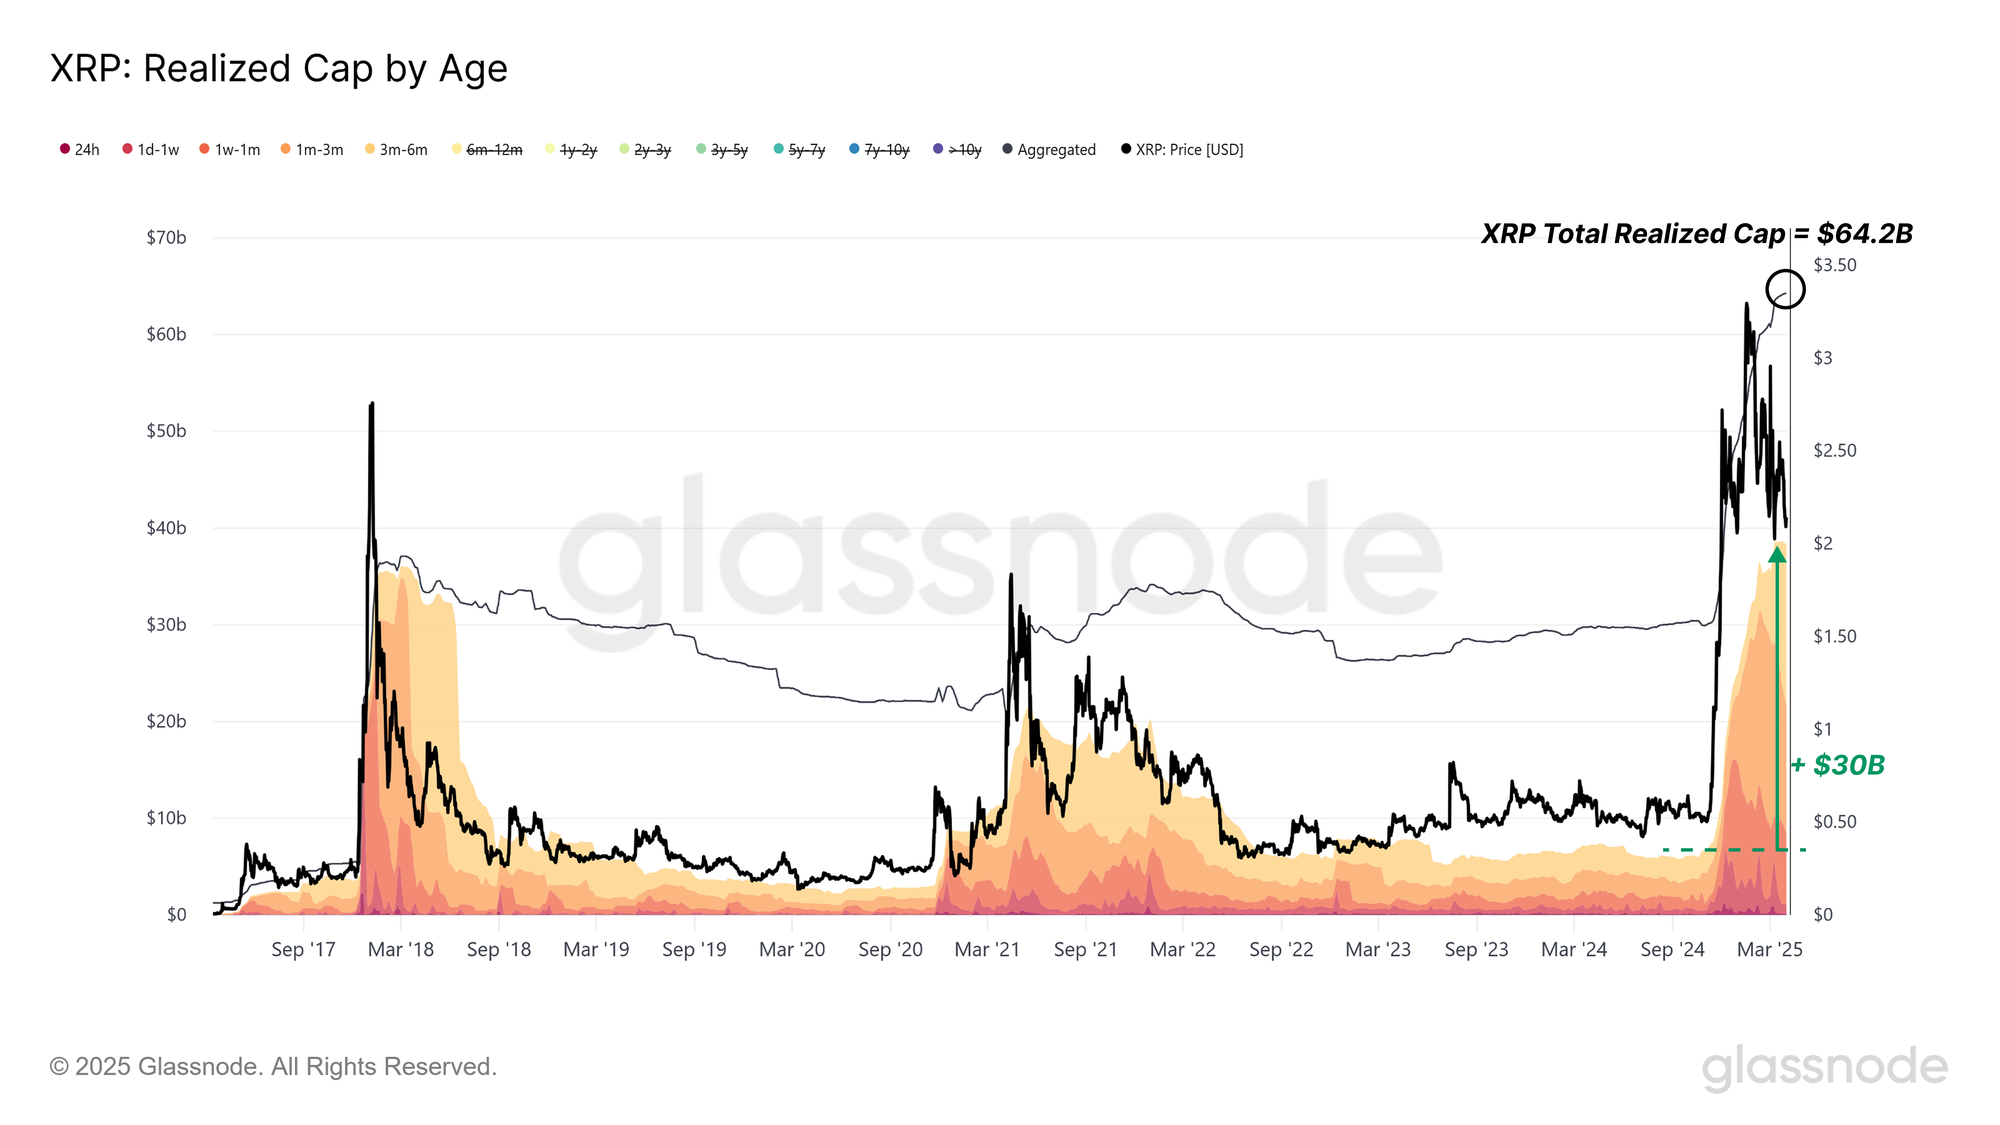
During this recent surge, XRP’s Realized Cap nearly doubled from $30.1B to $64.2B, reflecting a substantial inflow of capital. Notably, close to $30B of this increase came from investors deploying capital within the last six months, highlighting the short concentration of this retail-led rally.

However, this capital influx has started to slow down since late February 2025, signalling a potential cooling-off in speculative appetite.
Live Chart

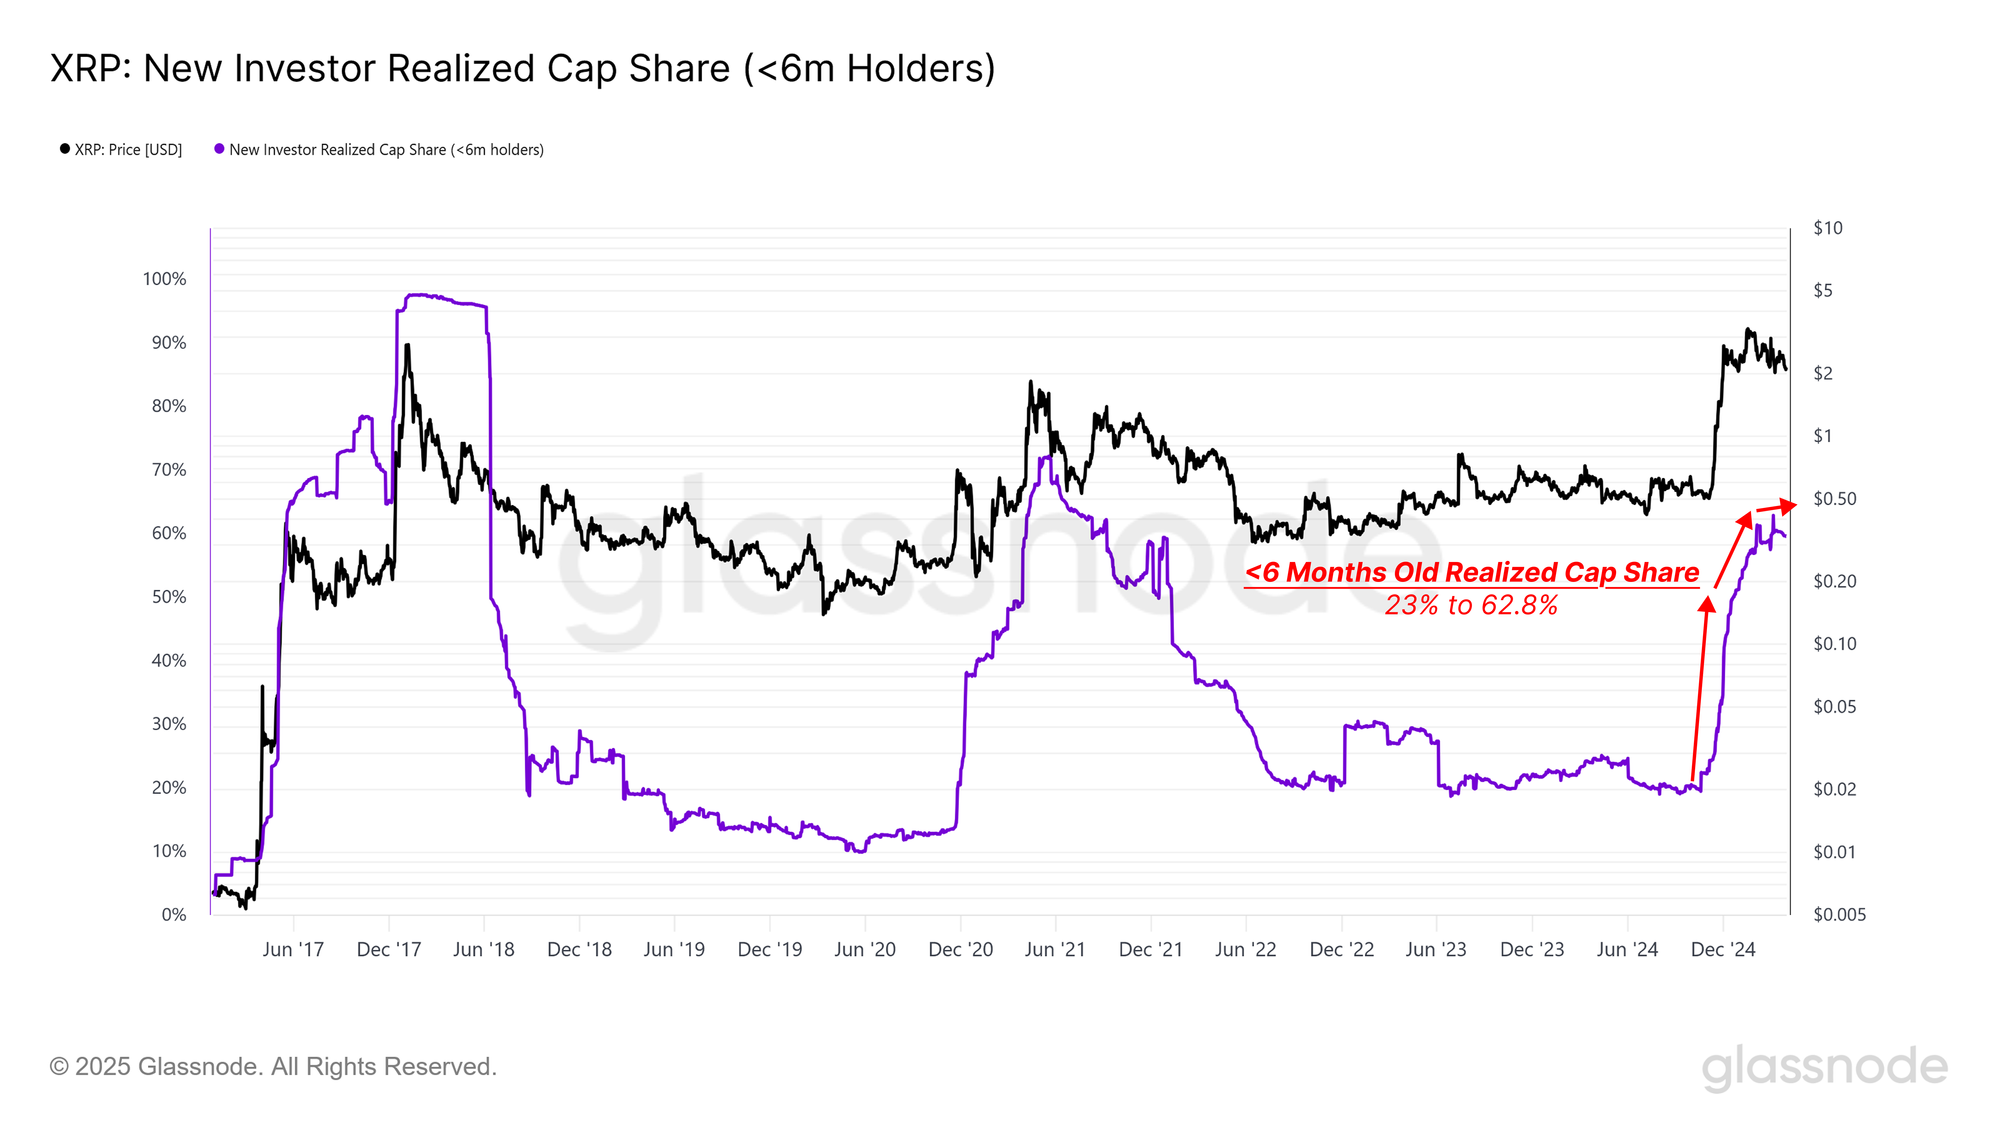
Alongside the short surge in capital flows, there’s been a rapid concentration of wealth in the hands of new investors, with the share of XRP’s realized cap, which is younger than 6 months, rising from 23% to 62.8% in just a short period of time.

When viewed together with the heavy retail participation, this sharp uplift in new holders raises caution signs, where many investors are likely to be vulnerable to downside volatility, given their now elevated cost basis.
Live Chart

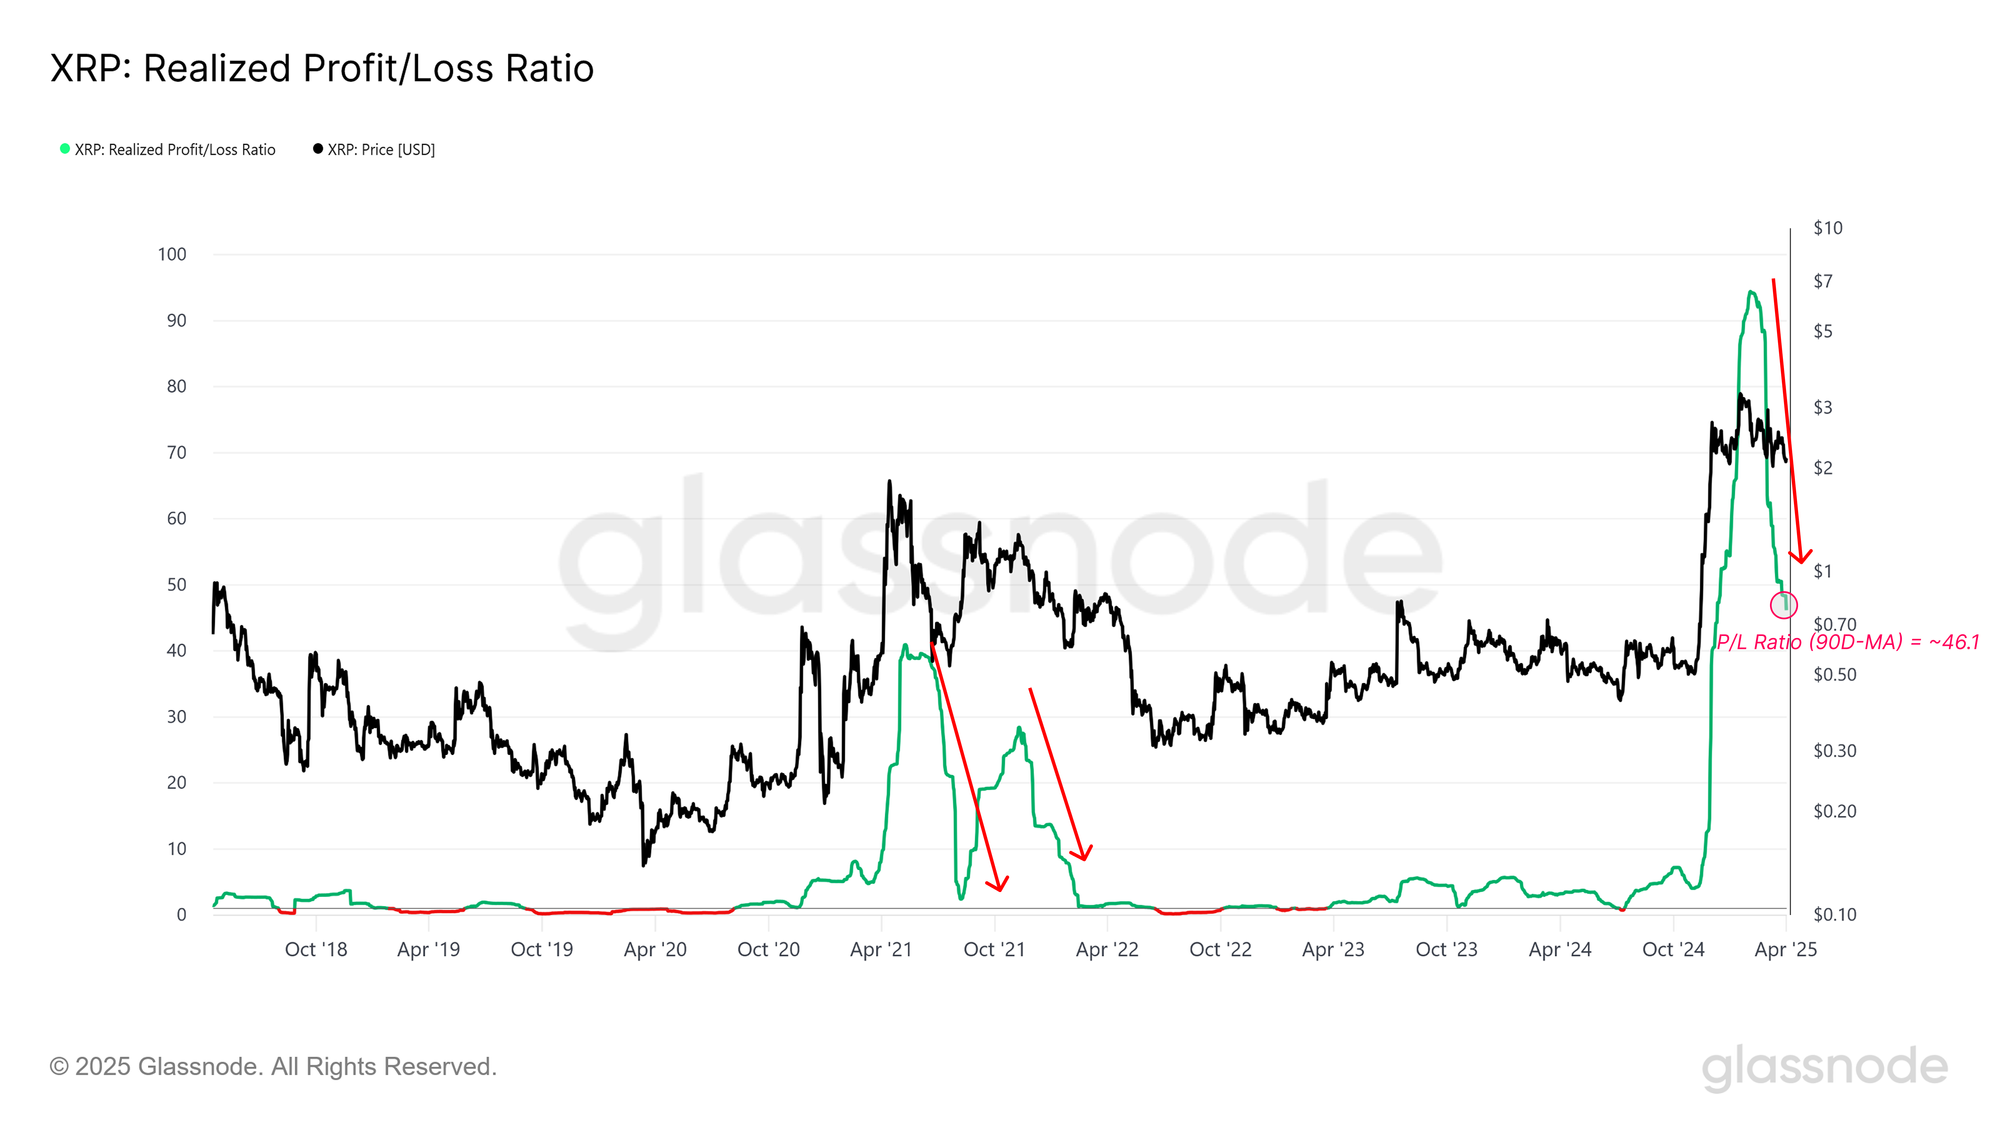
This resembles a top-heavy cost basis structure, which becomes even more concerning when we observe the Realized Loss/Profit Ratio for XRP. This metric has been in steady decline since January 2025, suggesting that investors are realizing fewer profits, and increasingly large losses.

These conditions are a common signal of waning confidence and a general move towards more fragile, higher-risk conditions. Given the retail-dominated inflows, and largely concentrated wealth in relatively new hands, this alludes to a condition where retail investor confidence may be slipping, both in XRP, but may also be extended across the broader market.
Live Chart

Summary and Conclusions

The Bitcoin market continues to digest the correction after the $109k ATH, with signs of increasing losses held, and locked in by investors. Although the price has stabilized above an area of demand around $76k–$80k, several on-chain momentum indicators suggest these may be relief rallies within a broader downtrend rather than the beginning of a sustainable reversal.

Analysis of XRP network trends also offers a proxy view for the magnitude of the risk appetite of retail investors. The asset has seen a dramatic uptick in address activity, capital inflows, and realized cap growth over the last 6-months. However, this enthusiasm appears to have reached a saturation point as profit-taking wanes, and losses have started to accelerate. The XRP market is showing signs of a top-heavy structure, with many investors caught on a relatively high-cost basis.

Altogether, this data reinforces a case where Bitcoin's correction is meaningful in scale but has not yet reached the severity of previous bear markets. For more speculative assets like XRP, demand may have already peaked, suggesting caution may be warranted until signs of a robust recovery start to emerge.


Disclaimer: This report does not provide any investment advice. All data is provided for information and educational purposes only. No investment decision shall be based on the information provided here and you are solely responsible for your own investment decisions.

Exchange balances presented are derived from Glassnode’s comprehensive database of address labels, which are amassed through both officially published exchange information and proprietary clustering algorithms. While we strive to ensure the utmost accuracy in representing exchange balances, it is important to note that these figures might not always encapsulate the entirety of an exchange’s reserves, particularly when exchanges refrain from disclosing their official addresses. We urge users to exercise caution and discretion when utilizing these metrics. Glassnode shall not be held responsible for any discrepancies or potential inaccuracies. Please read our Transparency Notice when using exchange data.


Letture associate

Retail Investors' 'Lead Brother' Serenity vs. Newly Minted Stock God Leopold: How Are the Two Top Hunters Mining AI's 'Physical Limits'?

The article profiles two prominent figures, Serenity and Leopold Aschenbrenner, who are gaining attention for their unconventional investment strategies focused on the physical constraints of the AI boom, moving beyond mainstream software narratives. Serenity, an anonymous online trader, advocates a "shiso leaf" theory. He targets small-cap companies with monopolies on critical, overlooked components in the AI hardware supply chain, such as specific semiconductor materials. His deep, technical analysis of bottlenecks in areas like co-packaged optics (CPO) has reportedly yielded massive returns, though his anonymity and focus on illiquid micro-cap stocks pose significant risks for followers. Leopold Aschenbrenner, a former OpenAI researcher, founded a multi-billion dollar hedge fund. His macro thesis argues that physical infrastructure—power grids, land, data centers—is the true bottleneck for AI growth, lagging far behind chip production. Consequently, his fund employs an infrastructure arbitrage strategy: heavily investing in storage and compute infrastructure companies while placing massive bearish bets (put options) against major semiconductor stocks, betting their valuations will correct as physical constraints become apparent. While their methods differ—Serenity drills into microscopic supply chain details, while Leopold takes a macroscopic, infrastructure-focused view—both share a core belief: the real power and investment alpha in the AI era lie in controlling scarce physical resources, not just software. The article concludes by noting the inherent risks in both approaches, such as liquidity issues for micro-caps and timing risks for macro bets, but suggests they signal a broader market re-evaluation of AI's foundational assets.

marsbit2 h fa

Retail Investors' 'Lead Brother' Serenity vs. Newly Minted Stock God Leopold: How Are the Two Top Hunters Mining AI's 'Physical Limits'?

marsbit2 h fa

Who Will Make Money in the Age of Agents?

In the Agents era of blockchain, traditional value capture theories face challenges. The "Fat Protocol" theory, dominant since 2016, suggested protocols capture most value as their tokens are essential for network use. However, the proliferation of interchangeable L1s, L2s, and modular layers has eroded protocol scarcity and pricing power. Conversely, the "Fat App" theory posits that applications capturing user relationships (like wallets and exchanges) become the primary value layer by controlling distribution and transaction flows. This aligns with the current "Great Repricing" cycle. Agents disrupt this logic. As software users, they lack brand loyalty, prioritize cost and efficiency, and switch between platforms seamlessly. This undermines the front-end UX moats that "Fat Apps" rely on. The article explores several potential futures: 1. **Headless Applications:** Current leading apps could strip their front-ends and become backend API infrastructure for Agents, preserving their role. 2. **Protocol Resurgence:** If integration becomes trivial, Agents might bypass aggregators and interact directly with protocols, reviving "Fat Protocol" dynamics. 3. **Pricing Power Collapse:** Agents' rational, frictionless routing could commoditize the entire stack, compressing margins toward cost and leaving little profit for intermediaries. 4. **Unprecedented Activity:** Agents may enable new, high-frequency, machine-to-machine economic activities, expanding the total value pie even if margins are thin. 5. **A New, Unnamed Model:** Historically, major tech shifts (like the internet's attention economy) create unforeseen business models. The Agents era may spawn entirely new ways to capture value. The most likely outcome is a coexistence where "Fat Apps" continue to serve human users valuing UX, while a separate, Agent-driven economy emerges governed by different rules—where loyalty is based on factors like liquidity, latency, and settlement guarantees rather than brand.

marsbit3 h fa

Who Will Make Money in the Age of Agents?

marsbit3 h fa

Trading

Spot
Futures

Articoli Popolari

Cosa è BITCOIN

Comprendere HarryPotterObamaSonic10Inu (ERC-20) e la sua posizione nel mondo delle criptovalute Negli ultimi anni, il mercato delle criptovalute ha assistito a un aumento della popolarità delle meme coin, catturando l'interesse non solo dei trader, ma anche di coloro che cercano coinvolgimento comunitario e valore di intrattenimento. Tra questi token unici c'è HarryPotterObamaSonic10Inu (ERC-20), un progetto intrigante che mescola riferimenti culturali nel tessuto delle criptovalute. Questo articolo esplora gli aspetti chiave di HarryPotterObamaSonic10Inu, analizzando i suoi meccanismi, l'etica guidata dalla comunità e il suo coinvolgimento con il panorama crittografico più ampio. Che cos'è HarryPotterObamaSonic10Inu (ERC-20)? Come suggerisce il suo nome, HarryPotterObamaSonic10Inu è una meme coin costruita sulla blockchain di Ethereum, classificata secondo lo standard ERC-20. A differenza delle criptovalute tradizionali che possono enfatizzare l'utilità pratica o il potenziale investimento, questo token prospera grazie al valore di intrattenimento e alla forza della sua comunità. Il progetto mira a creare un ambiente in cui gli utenti coinvolti possono riunirsi, condividere idee e partecipare ad attività ispirate a diversi fenomeni culturali. Una caratteristica notevole di HarryPotterObamaSonic10Inu è la zero tassa sulle transazioni. Questo elemento allettante tende a incoraggiare il trading e il coinvolgimento della comunità, privo di costi aggiuntivi che possono scoraggiare i trader di piccole dimensioni. L'offerta totale della moneta è fissata a un miliardo di token, un numero che segna la sua intenzione di mantenere una circolazione sostanziale all'interno della comunità. Creatore di HarryPotterObamaSonic10Inu (ERC-20) Le origini di HarryPotterObamaSonic10Inu sono avvolte in un certo mistero; i dettagli sul creatore rimangono sconosciuti. Lo sviluppo di questo token non presenta un team identificabile o un piano esplicito, cosa non rara nel settore delle meme coin. Invece, il progetto è emerso organicamente, con il suo progresso fortemente dipendente dall'entusiasmo e dalla partecipazione della sua comunità. Investitori di HarryPotterObamaSonic10Inu (ERC-20) Per quanto riguarda investimenti esterni e finanziamenti, HarryPotterObamaSonic10Inu rimane ambiguo. Il token non elenca alcuna fondazione di investimento conosciuta o un sostegno organizzativo significativo. Invece, la linfa vitale del progetto è la sua comunità di base, che informa la sua crescita e sostenibilità attraverso azioni collettive e coinvolgimento nello spazio crittografico. Come funziona HarryPotterObamaSonic10Inu (ERC-20)? In quanto meme coin, HarryPotterObamaSonic10Inu opera principalmente al di fuori delle strutture tradizionali che governano spesso il valore degli asset. Ci sono diversi aspetti distintivi che definiscono il funzionamento del progetto: Transazioni senza tasse: Senza costi fiscali sulle transazioni, gli utenti possono comprare e vendere liberamente il token senza preoccuparsi di costi nascosti. Coinvolgimento della comunità: Il progetto prospera sull'interazione della comunità, sfruttando le piattaforme social per creare entusiasmo e facilitare il coinvolgimento. Discussioni, condivisione di contenuti e coinvolgimento sono elementi cruciali che aiutano ad espandere la sua portata e a favorire la lealtà tra i sostenitori. Nessuna utilità pratica: Va notato che HarryPotterObamaSonic10Inu non offre un'utilità concreta all'interno dell'ecosistema finanziario. Piuttosto, è classificato come un token principalmente per attività di intrattenimento e comunitarie. Riferimento culturale: Il token incorpora astutamente elementi della cultura pop per attirare interesse, collegandosi a appassionati di meme e seguaci delle criptovalute. HarryPotterObamaSonic10Inu esemplifica come le meme coin operino in modo diverso rispetto ai progetti di criptovalute più tradizionali, entrando nel mercato come costrutti sociali innovativi piuttosto che come asset utilitari. Cronologia di HarryPotterObamaSonic10Inu (ERC-20) La storia di HarryPotterObamaSonic10Inu è segnata da diversi traguardi notevoli: Creazione: Il token è emerso da un meme virale, catturando l'immaginazione di molti appassionati di criptovalute. Le date di creazione specifiche non sono disponibili, sottolineando la sua crescita organica. Inserimento negli scambi: HarryPotterObamaSonic10Inu ha fatto il suo ingresso in vari scambi, consentendo un accesso e un trading più facili da parte della comunità. Iniziative di coinvolgimento della comunità: Attività in corso volte a migliorare l'interazione della comunità, comprese gare, campagne sui social media e generazione di contenuti da parte di fan e sostenitori. Piani di espansione futura: La tabella di marcia del progetto include il lancio di una collezione NFT, merchandising e un sito di eCommerce relativo ai suoi temi culturali, coinvolgendo ulteriormente la comunità e cercando di aggiungere più dimensioni al suo ecosistema. Punti chiave su HarryPotterObamaSonic10Inu (ERC-20) Natura guidata dalla comunità: Il progetto dà priorità al contributo collettivo e alla creatività, garantendo che il coinvolgimento degli utenti sia al centro del suo sviluppo. Classificazione come meme coin: Rappresenta l'epitome delle criptovalute basate sull'intrattenimento, distinguendosi dai veicoli d'investimento tradizionali. Nessuna affiliazione diretta con Bitcoin: Nonostante la somiglianza nel nome del ticker, HarryPotterObamaSonic10Inu è distintivo e non ha alcuna relazione con Bitcoin o altre criptovalute consolidate. Focus sulla collaborazione: HarryPotterObamaSonic10Inu è progettato per creare uno spazio per la collaborazione e la condivisione di storie tra i suoi detentori, fornendo un canale per la creatività e il legame comunitario. Prospettive future: L'ambizione di espandersi oltre il suo presupposto iniziale verso NFT e merchandising delinea un percorso per il progetto per potenzialmente entrare in strade più mainstream all'interno della cultura digitale. Poiché le meme coin continuano a catturare l'immaginazione della comunità crittografica, HarryPotterObamaSonic10Inu (ERC-20) si distingue per i suoi legami culturali e il suo approccio centrato sulla comunità. Anche se potrebbe non adattarsi al modello tipico di un token orientato all'utilità, la sua essenza risiede nella gioia e nella camaraderia coltivate tra i suoi sostenitori, evidenziando la natura in evoluzione delle criptovalute in un'epoca sempre più digitale. Con la continuazione dello sviluppo del progetto, sarà importante osservare come le dinamiche della comunità influenzano la sua traiettoria nel panorama in continuo cambiamento della tecnologia blockchain.

1.5k Totale visualizzazioniPubblicato il 2024.04.01Aggiornato il 2024.12.03

Cosa è BITCOIN

Come comprare BTC

Benvenuto in HTX.com! Abbiamo reso l'acquisto di Bitcoin (BTC) semplice e conveniente. Segui la nostra guida passo passo per intraprendere il tuo viaggio nel mondo delle criptovalute.Step 1: Crea il tuo Account HTXUsa la tua email o numero di telefono per registrarti il tuo account gratuito su HTX. Vivi un'esperienza facile e sblocca tutte le funzionalità,Crea il mio accountStep 2: Vai in Acquista crypto e seleziona il tuo metodo di pagamentoCarta di credito/debito: utilizza la tua Visa o Mastercard per acquistare immediatamente BitcoinBTC.Bilancio: Usa i fondi dal bilancio del tuo account HTX per fare trading senza problemi.Terze parti: abbiamo aggiunto metodi di pagamento molto utilizzati come Google Pay e Apple Pay per maggiore comodità.P2P: Fai trading direttamente con altri utenti HTX.Over-the-Counter (OTC): Offriamo servizi su misura e tassi di cambio competitivi per i trader.Step 3: Conserva Bitcoin (BTC)Dopo aver acquistato Bitcoin (BTC), conserva nel tuo account HTX. In alternativa, puoi inviare tramite trasferimento blockchain o scambiare per altre criptovalute.Step 4: Scambia Bitcoin (BTC)Scambia facilmente Bitcoin (BTC) nel mercato spot di HTX. Accedi al tuo account, seleziona la tua coppia di trading, esegui le tue operazioni e monitora in tempo reale. Offriamo un'esperienza user-friendly sia per chi ha appena iniziato che per i trader più esperti.

3.8k Totale visualizzazioniPubblicato il 2024.12.12Aggiornato il 2025.03.21

Come comprare BTC

Cosa è $BITCOIN

ORO DIGITALE ($BITCOIN): Un'Analisi Completa Introduzione all'ORO DIGITALE ($BITCOIN) L'ORO DIGITALE ($BITCOIN) è un progetto basato su blockchain che opera sulla rete Solana, con l'obiettivo di combinare le caratteristiche dei metalli preziosi tradizionali con l'innovazione delle tecnologie decentralizzate. Sebbene condivida un nome con Bitcoin, spesso definito “oro digitale” a causa della sua percezione come riserva di valore, l'ORO DIGITALE è un token separato progettato per creare un ecosistema unico all'interno del panorama Web3. Il suo obiettivo è posizionarsi come un asset digitale alternativo valido, anche se i dettagli riguardanti le sue applicazioni e funzionalità sono ancora in fase di sviluppo. Cos'è l'ORO DIGITALE ($BITCOIN)? L'ORO DIGITALE ($BITCOIN) è un token di criptovaluta esplicitamente progettato per l'uso sulla blockchain di Solana. A differenza di Bitcoin, che fornisce un ruolo di stoccaggio di valore ampiamente riconosciuto, questo token sembra concentrarsi su applicazioni e caratteristiche più ampie. Aspetti notevoli includono: Infrastruttura Blockchain: Il token è costruito sulla blockchain di Solana, nota per la sua capacità di gestire transazioni ad alta velocità e a basso costo. Dinamiche di Offerta: L'ORO DIGITALE ha un'offerta massima fissata a 100 quadrilioni di token (100P $BITCOIN), sebbene i dettagli riguardanti la sua offerta circolante siano attualmente non divulgati. Utilità: Sebbene le funzionalità precise non siano esplicitamente delineate, ci sono indicazioni che il token potrebbe essere utilizzato per varie applicazioni, potenzialmente coinvolgendo applicazioni decentralizzate (dApp) o strategie di tokenizzazione degli asset. Chi è il Creatore dell'ORO DIGITALE ($BITCOIN)? Attualmente, l'identità dei creatori e del team di sviluppo dietro l'ORO DIGITALE ($BITCOIN) rimane sconosciuta. Questa situazione è tipica tra molti progetti innovativi nel settore blockchain, in particolare quelli allineati con la finanza decentralizzata e i fenomeni delle meme coin. Sebbene tale anonimato possa favorire una cultura guidata dalla comunità, intensifica le preoccupazioni riguardo alla governance e alla responsabilità. Chi sono gli Investitori dell'ORO DIGITALE ($BITCOIN)? Le informazioni disponibili indicano che l'ORO DIGITALE ($BITCOIN) non ha alcun sostenitore istituzionale noto o investimenti di venture capital prominenti. Il progetto sembra operare su un modello peer-to-peer incentrato sul supporto e sull'adozione della comunità piuttosto che su percorsi di finanziamento tradizionali. La sua attività e liquidità si trovano principalmente su exchange decentralizzati (DEX), come PumpSwap, piuttosto che su piattaforme di trading centralizzate consolidate, evidenziando ulteriormente il suo approccio di base. Come Funziona l'ORO DIGITALE ($BITCOIN) Le meccaniche operative dell'ORO DIGITALE ($BITCOIN) possono essere elaborate in base al suo design blockchain e alle caratteristiche della rete: Meccanismo di Consenso: Sfruttando il proof-of-history (PoH) unico di Solana combinato con un modello di proof-of-stake (PoS), il progetto garantisce una validazione efficiente delle transazioni contribuendo all'alta performance della rete. Tokenomics: Sebbene meccanismi deflazionistici specifici non siano stati dettagliati ampiamente, l'ampia offerta massima di token implica che potrebbe soddisfare microtransazioni o casi d'uso di nicchia che devono ancora essere definiti. Interoperabilità: Esiste il potenziale per l'integrazione con l'ecosistema più ampio di Solana, inclusi vari piattaforme di finanza decentralizzata (DeFi). Tuttavia, i dettagli riguardanti integrazioni specifiche rimangono non specificati. Cronologia degli Eventi Chiave Ecco una cronologia che evidenzia traguardi significativi riguardanti l'ORO DIGITALE ($BITCOIN): 2023: Il dispiegamento iniziale del token avviene sulla blockchain di Solana, contrassegnato dal suo indirizzo di contratto. 2024: L'ORO DIGITALE guadagna visibilità poiché diventa disponibile per il trading su exchange decentralizzati come PumpSwap, consentendo agli utenti di scambiarlo contro SOL. 2025: Il progetto assiste a un'attività di trading sporadica e a un potenziale interesse per impegni guidati dalla comunità, sebbene non siano state documentate partnership significative o avanzamenti tecnici fino ad ora. Analisi Critica Punti di Forza Scalabilità: L'infrastruttura sottostante di Solana supporta alti volumi di transazioni, il che potrebbe migliorare l'utilità di $BITCOIN in vari scenari di transazione. Accessibilità: Il potenziale basso prezzo di trading per token potrebbe attrarre investitori al dettaglio, facilitando una partecipazione più ampia grazie a opportunità di proprietà frazionata. Rischi Mancanza di Trasparenza: L'assenza di sostenitori, sviluppatori o di un processo di audit pubblicamente noti potrebbe generare scetticismo riguardo alla sostenibilità e all'affidabilità del progetto. Volatilità del Mercato: L'attività di trading è fortemente dipendente dal comportamento speculativo, il che può comportare una significativa volatilità dei prezzi e incertezze per gli investitori. Conclusione L'ORO DIGITALE ($BITCOIN) emerge come un progetto intrigante ma ambiguo all'interno dell'evolvente ecosistema di Solana. Sebbene tenti di sfruttare la narrativa dell'“oro digitale”, la sua partenza dal ruolo consolidato di Bitcoin come riserva di valore sottolinea la necessità di una chiara differenziazione della sua utilità e struttura di governance. L'accettazione e l'adozione future dipenderanno probabilmente dall'affrontare l'attuale opacità e dalla definizione più esplicita delle sue strategie operative ed economiche. Nota: Questo rapporto comprende informazioni sintetizzate disponibili a ottobre 2023, e potrebbero essersi verificati sviluppi oltre il periodo di ricerca.

99 Totale visualizzazioniPubblicato il 2025.05.13Aggiornato il 2025.05.13

Cosa è $BITCOIN

Discussioni

Benvenuto nella Community HTX. Qui puoi rimanere informato sugli ultimi sviluppi della piattaforma e accedere ad approfondimenti esperti sul mercato. Le opinioni degli utenti sul prezzo di BTC BTC sono presentate come di seguito.

活动图片