Metaverse tokens up 400% year on year despite altcoin bloodbath

CointelegraphPubblicato 2022-06-08Pubblicato ultima volta 2022-06-08

Introduzione

A new report reveals that Metaverse tokens were one of only two categories of crypto that saw year-on-year growth in prices.

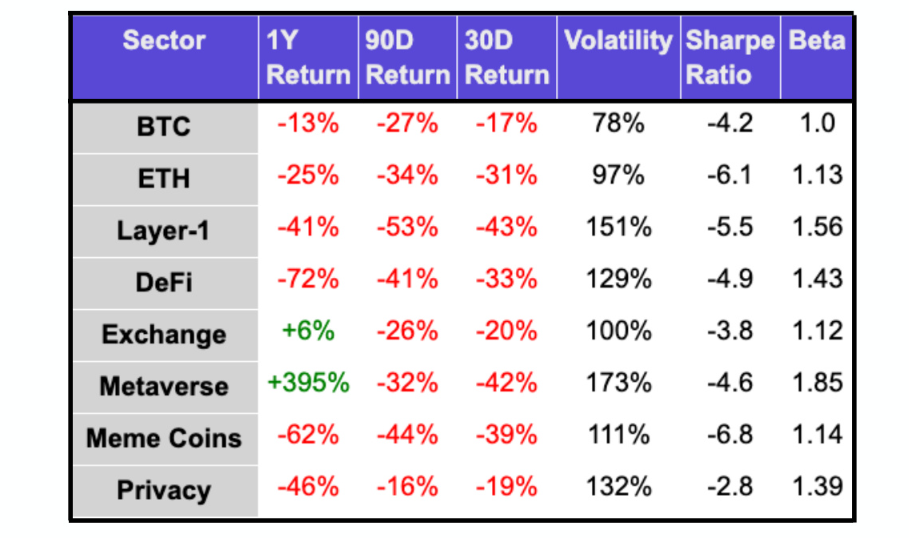
Metaverse tokens are vastly outperforming every other crypto category in the current bearish condition, up by nearly 400% year-on-year.

Leading the gains are Decentraland (MANA) up 41%, Sandbox (SAND) up 470%, Axie Infinity (AXS) up 511%, and STEPN (GMT) up 746% according to data from the May 2022 market report by and CoinGecko. Metaverse tokens can be used to pay fees, buy land, and participate in governance.

The next highest category for year-on-year gains were exchange tokens that saw a 6% increase. All other categories saw negative price action in the same time period ranging from -13% for Bitcoin to -72% for DeFi.

Blockchain-based gaming using nonfungible tokens (NFT) and Metaverse platforms has remained tremendously popular throughout 2022 so far. Despite slumping prices across the market, usership among those games has remained consistent at about 1 million users per day according to data from decentralized app (Dapp) tracker DappRadar.

The report pointed out that although May saw flat daily usership, “NFT volume saw a large decrease with daily volume dropping -87.1%.”

Every category tracked by the report, including Metaverse and exchange tokens, experienced negative returns over the past 30 days and 90 days. Metaverse tokens were among the worst losers over the past 30 days, dropping 42%, with by far the highest volatility at 173%.

Despite the short term price action, money is pouring in to fund the sector. DAppRadar’s Q1 games report noted that $2.5 billion was raised in support of blockchain games and Metaverse projects in the first quarter of 2022. Investors were eager to back games according to the report because 52% of all blockchain activity came from game DApps:

“At this pace, play-to-earn and Metaverse-related projects will add $10 billion this year to keep building the future of this industry.”

Layer-1 tokens such as Solana (SOL) and Cardano (ADA) led the losers as over the past 90 days, they are down 53% and down 43% over the past 30 days.

Bitcoin (BTC) and Ethereum (ETH) saw relatively modest losses compared to altcoins over all three time frames measured by Kraken.

Letture associate

Bitcoin Trading Strategy Breakdown: Celebrity Predictions and Classic Models All Fail, Only These Four Indicators Remain

Analysis of Bitcoin Trading Strategies: Why Celebrity Forecasts and Classic Models Fail, Leaving Only These Four Reliable Indicators This analysis examines the failure of common Bitcoin prediction methods and identifies four reliable indicators for constructing a trading strategy. The author reviewed all major BTC prediction approaches from 2017-2025, categorizing them into three groups: celebrity price targets (consistently over-optimistic), analytical models like Stock-to-Flow (broken post-2022), and on-chain signals. The key finding is that more data often creates confusion, not clarity. The strategy discards unreliable elements: celebrity predictions (incentivized to be extreme), pure models (invalidated by post-ETF market changes), and the Fear & Greed Index used alone (too many false signals). Four reliable indicators were selected: 1. **MVRV Z-Score:** Accurately identifies cycle bottoms when entering its green zone (e.g., 2018, 2020, 2022). Note: Its ability to call tops is now ineffective post-2024. 2. **SOPR (28-day MA):** Consistently signals bottoms when below 1.0, indicating holders are selling at a loss. 3. **ETF Net Flow:** A crucial post-2024 metric showing institutional momentum (e.g., sustained inflows = buying). 4. **Macro Liquidity (Fed policy & M2):** Sets the overall directional bias (e.g., bullish during easing cycles). The core strategy involves waiting for a multi-signal共振 (resonance). For example, a bottom signal requires MVRV in the green zone + SOPR < 1.0. A top signal requires overheated on-chain data + sustained ETF outflows. Macro policy sets the overall direction. The Fear & Greed Index is only used as a weighted confirmatory signal, never alone. Action is only taken when three or more indicators align. The author automated this into a monitoring system that sends Telegram alerts only when signals trigger. As of the article's date (April 15, 2026), the system showed a strong bottom signal: extreme fear (F&G=12), MVRV in the buy zone, and SOPR < 1.0. The only contrary signal was weak ETF flows. Historically, such triple on-chain共振 has preceded 100%+ returns. The conclusion emphasizes building a personal framework over relying on external predictions, allowing for iterative improvement and customization based on individual risk tolerance.

marsbit1 h fa

Bitcoin Trading Strategy Breakdown: Celebrity Predictions and Classic Models All Fail, Only These Four Indicators Remain

marsbit1 h fa

Trading

Spot
Futures
活动图片