Bitcoin's (BTC) short-term price action has been dominated by whipsaws that trigger around the $31,000 to $32,000 level and the June 6 reversal at this point triggered a quick sell-off that pushed the price down to $29,200.
Surprisingly, on June 7, the price rapidly reversed course as Bitcoin rallied back to $31,500, but given the current rejection at this level, traders are likely to proceed cautiously, rather than expect a quick surge to $35,000.
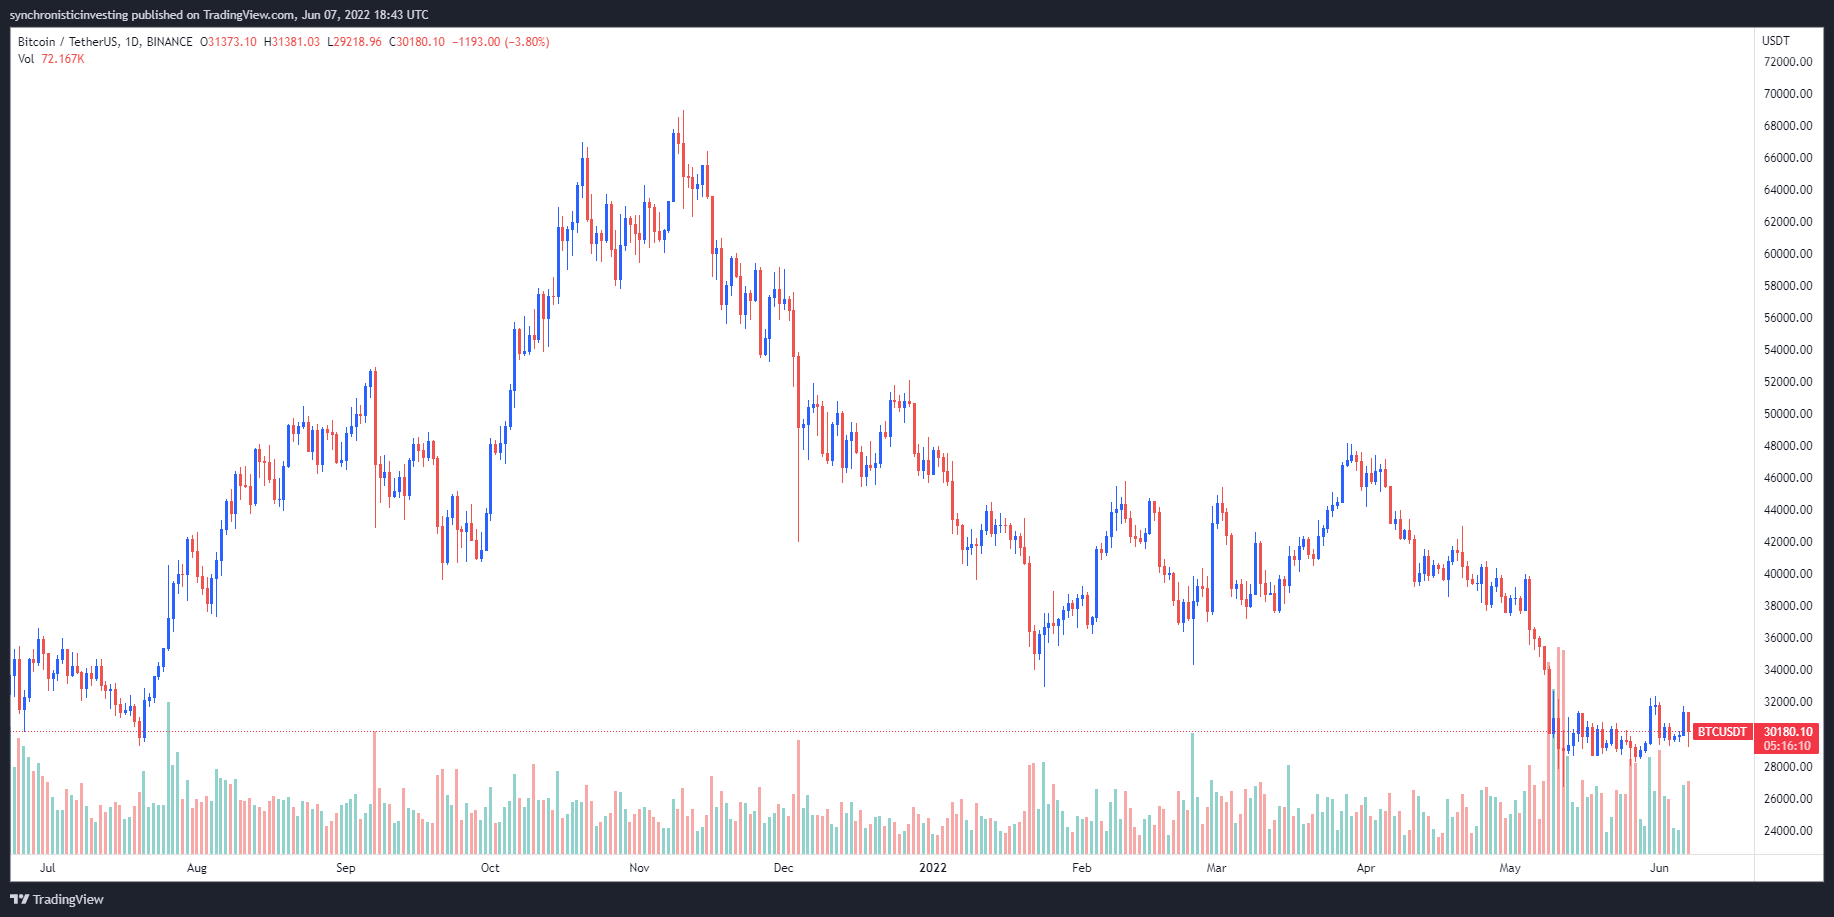
BTC/USDT 1-day chart. Source: TradingView
Here’s what several analysts are saying about the short-term outlook for BTC and what support levels to keep an eye on moving forward.
A clear redistribution range
The range-bound trading currently impacting Bitcoin was addressed by crypto analyst and pseudonymous Twitter user il Capo of Crypto, who posted the following chart highlighting the “clean range” that BTC has been stuck in for nearly a month.
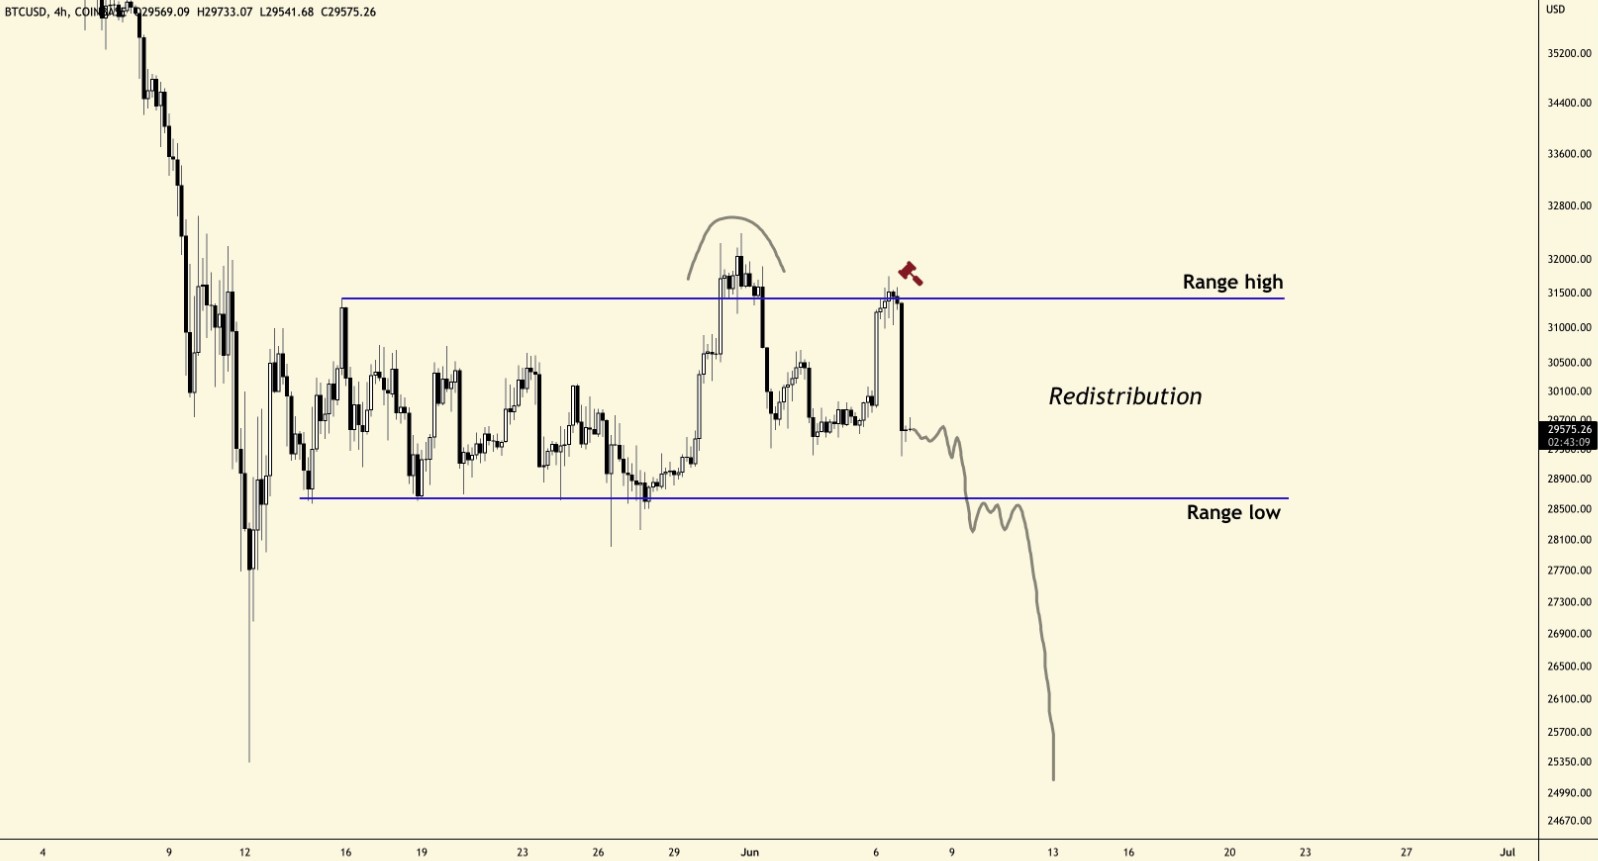
BTC/USD 4-hour chart. Source: Twitter
The analyst said,
“What is happening inside the range and what has happened at the range high, shows that this is [a] clear redistribution range. Clean break of the range low = last leg down confirmed = 21K–23K.”
Ongoing flip-flop price action
A slightly different outcome to the current market chop was suggested by crypto trader and pseudonymous Twitter user Phoenix, who posted the following chart lamenting the month-long range-bound trading for BTC and hinted that it will see more of the same.
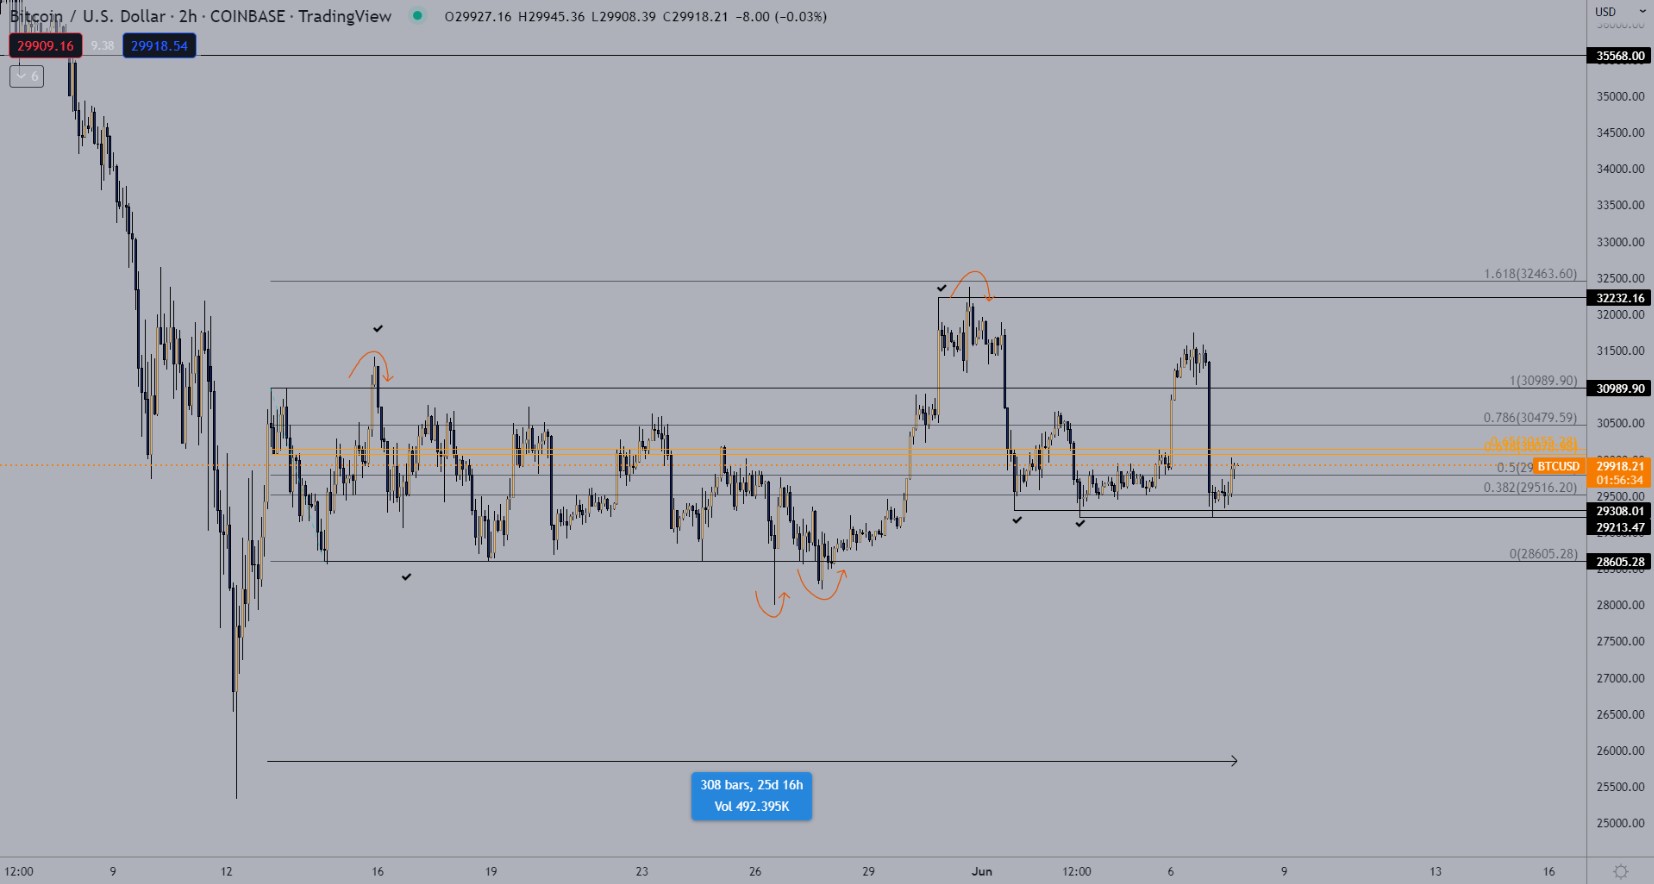
BTC/USD 2-hour chart. Source: Twitter
Phoenix said,
“On our way towards a whole month inside a mini-range again to fully deploy the flip-flop-your-bias-non-stop-angry-pleb-and-gtfo. *Ppl fomoed the top, lows taken again after the nuke, up we go again?*”
Related: Coinbase balance drops by 30K BTC as Bitcoin price nurses 6% losses
A possible flush out to $20K
For traders trying to get some sense of where the bottom might be, market analyst and pseudonymous Twitter user Rekt Capital posted the following chart highlighting the 200-EMA (exponential moving average) as a key indicator to watch.
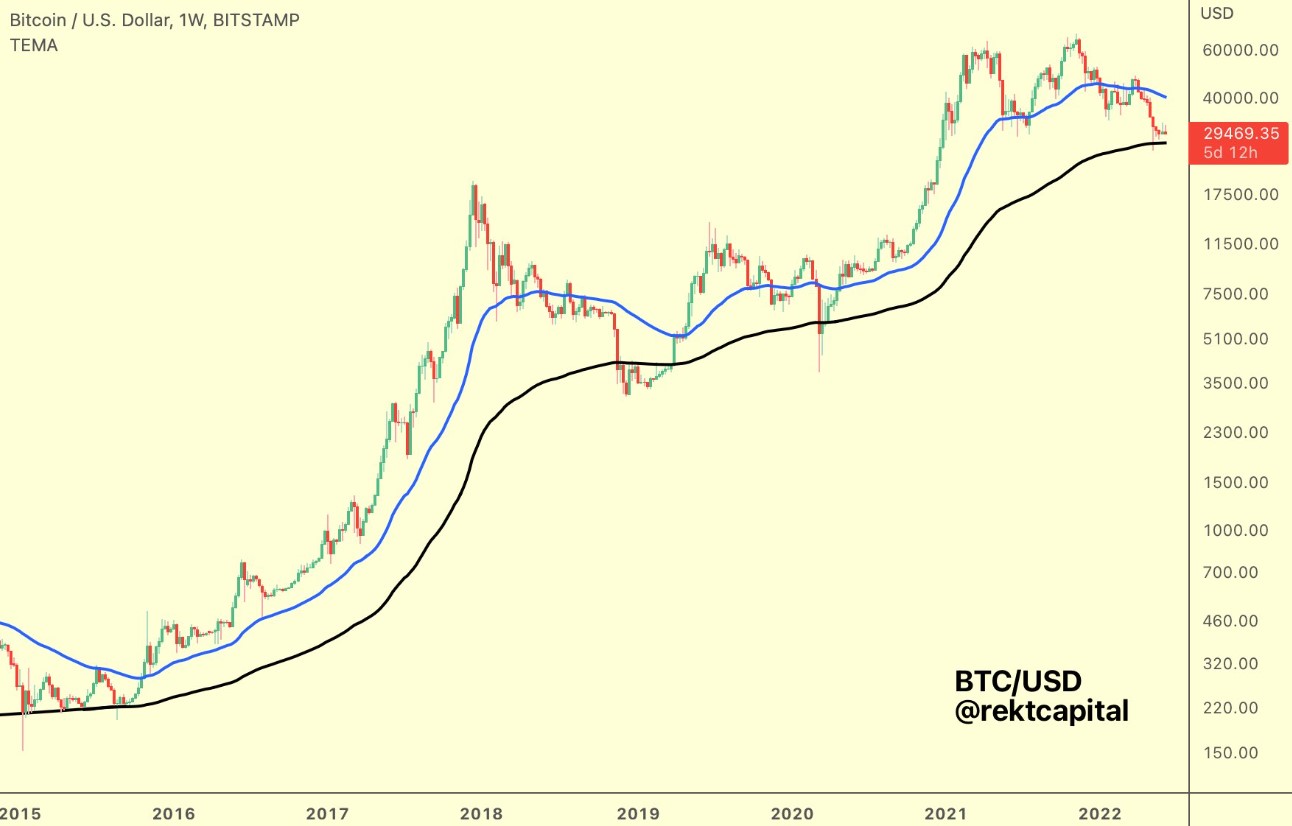
BTC/USD 1-week chart. Source: Twitter
According to Rekt Capital, the price history for Bitcoin shows that while it “tends to confirm uptrends when it breaks above the blue 50-week EMA,” on the flip side it “tends to confirm maximum financial opportunity when it reaches and breaks down from the black 200-week EMA.”
A closer look at the recent price action around these indicators was provided in the following chart posted by Rekt Capital to provide a better picture of what support level to look out for.
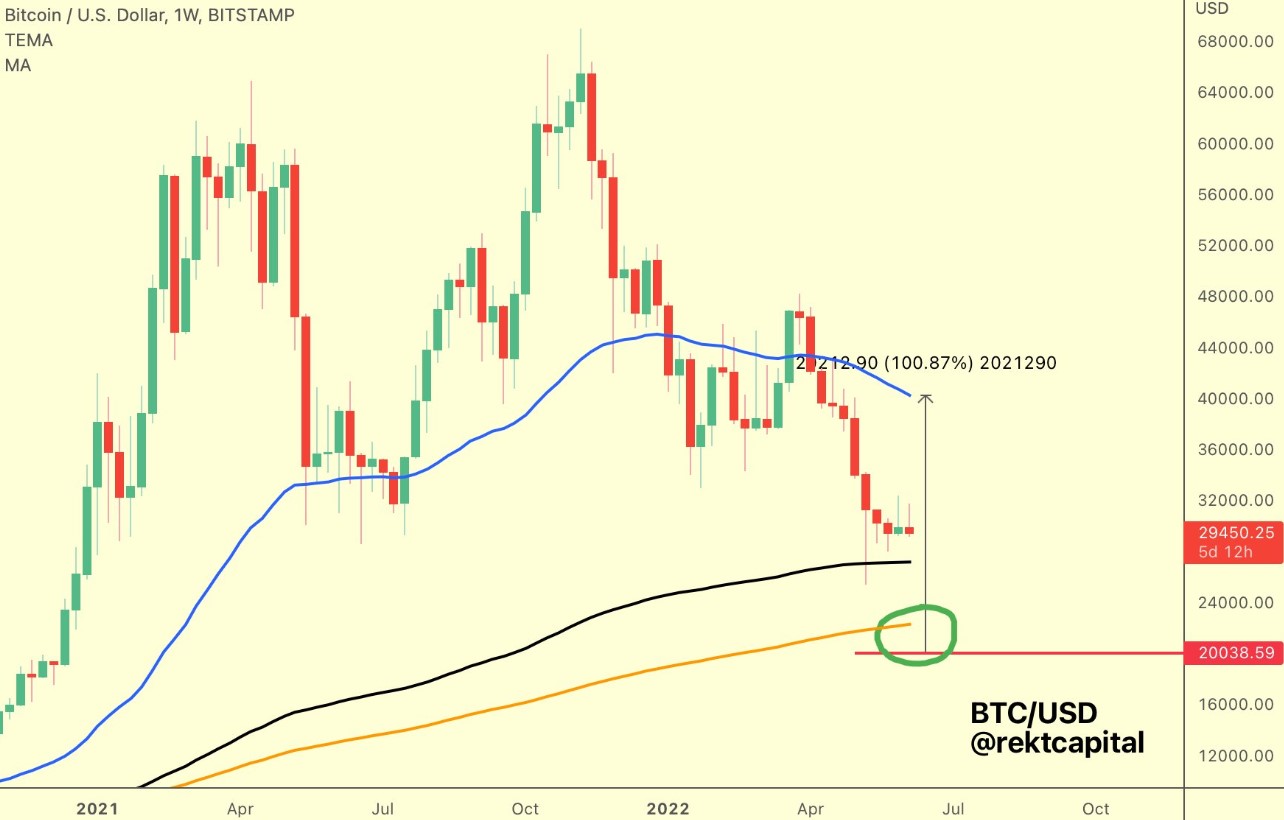
BTC/USD 1-week chart. Source: Twitter
Rekt Capital said,
“This area is ~confluent with the orange #BTC 200-week MA. In fact, $BTC would need to downside wick below the 200MA to reach the ~$20K area. Interestingly, downside wicking tends to occur below the 200MA to mark out generational bottoms.”
The overall cryptocurrency market cap now stands at $1.24 trillion and Bitcoin’s dominance rate is 46.4%.