

Noorr
06/28 06:23
SUI Wave 3 Targets Point Toward $10+ Zone The dai
SUI Wave 3 Targets Point Toward $10+ Zone
The daily chart, according to Elliott Wave Theory, shows a bullish formation with Wave (1) spanning $0.50 to nearly $1.80 and a Wave (2) corrective bottoming at $0.90 or $1.00.
The Wave (3), expected with typical projection ratios, may take SUI into a speculative $10–$12 region, an approximately 900% rise from Wave 2’s low. The target area is highlighted on the chart with a green-shaded extension region, signaling long-term upside potential.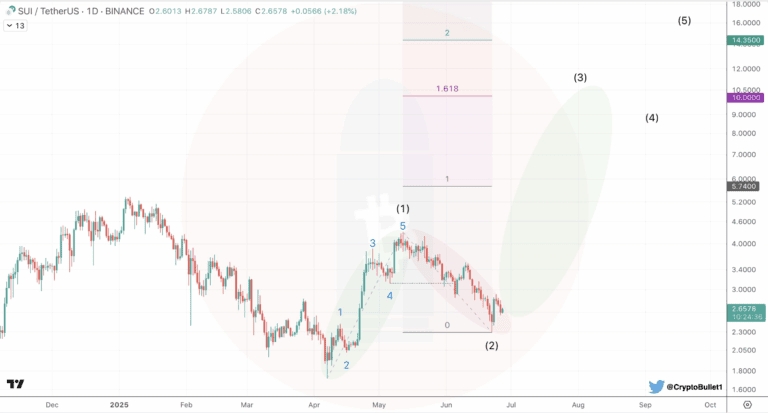
#Share Your Thoughts on Popular Assets in June#Join HTX On A Fitness Journey To Mars#Join HTX 12th Anniversary Quiz Challenge
2Condividi
Tutti i commenti0RecentePopolare
Nessuno storico