Stellar’s $0.142 test – Why it may be the buying chance traders await

ambcryptoDipublikasikan tanggal 2026-06-26Terakhir diperbarui pada 2026-06-26

Abstrak

Stellar's XLM extended its decline, dropping 7.85% to $0.1514 despite a 10.55% increase in trading volume. This suggests active selling rather than support for a recovery. Key technical indicators point to persistent bearish control. XLM broke a key horizontal support and remains below a descending trendline, with the MACD in a bearish crossover and Parabolic SAR dots above the price. The RSI is at 34.42, nearing oversold territory, and the DMI shows bearish momentum is intact. The analysis indicates XLM is likely to drift toward the next major demand zone at $0.142 before any potential recovery attempt can gain traction.

Stellar [XLM] extended its decline after sellers retained firm control despite a pickup in market activity.

The token traded at around $0.1514 at press time, reflecting a 7.85% daily loss, while trading volume climbed 10.55% to $236.47 million. The combination suggests market participants actively traded into the decline instead of supporting a recovery.

XLM drifted toward its next demand zone

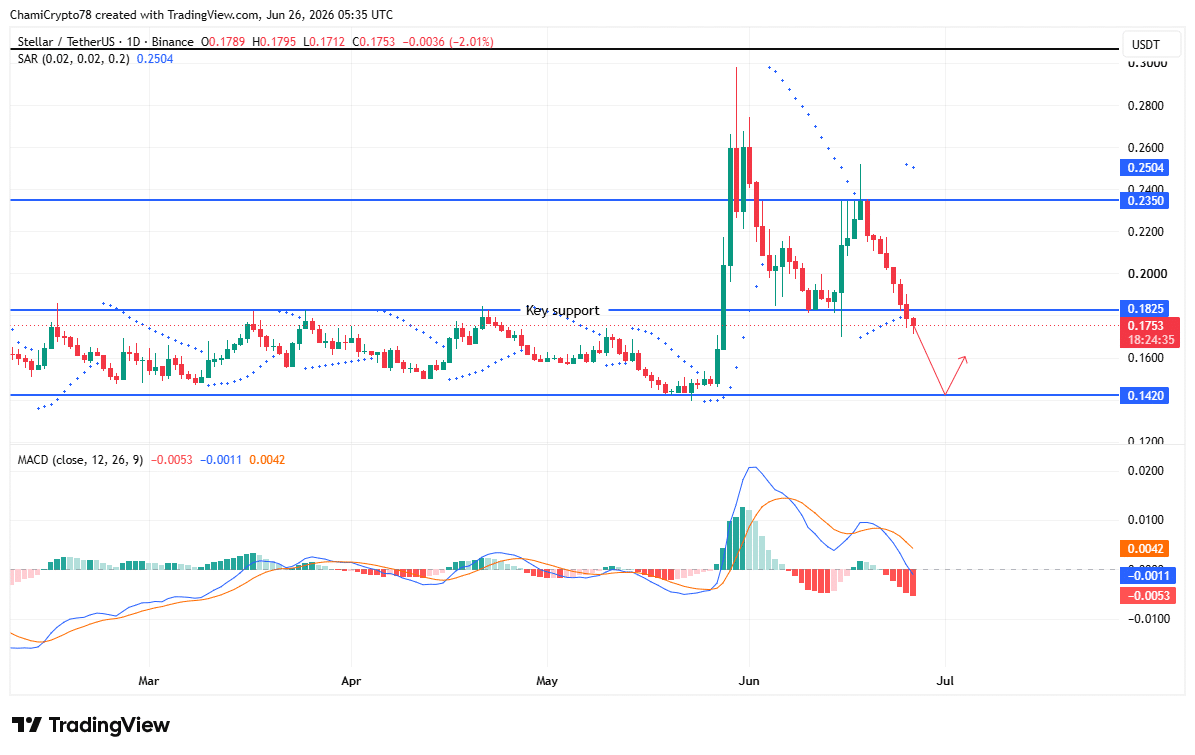
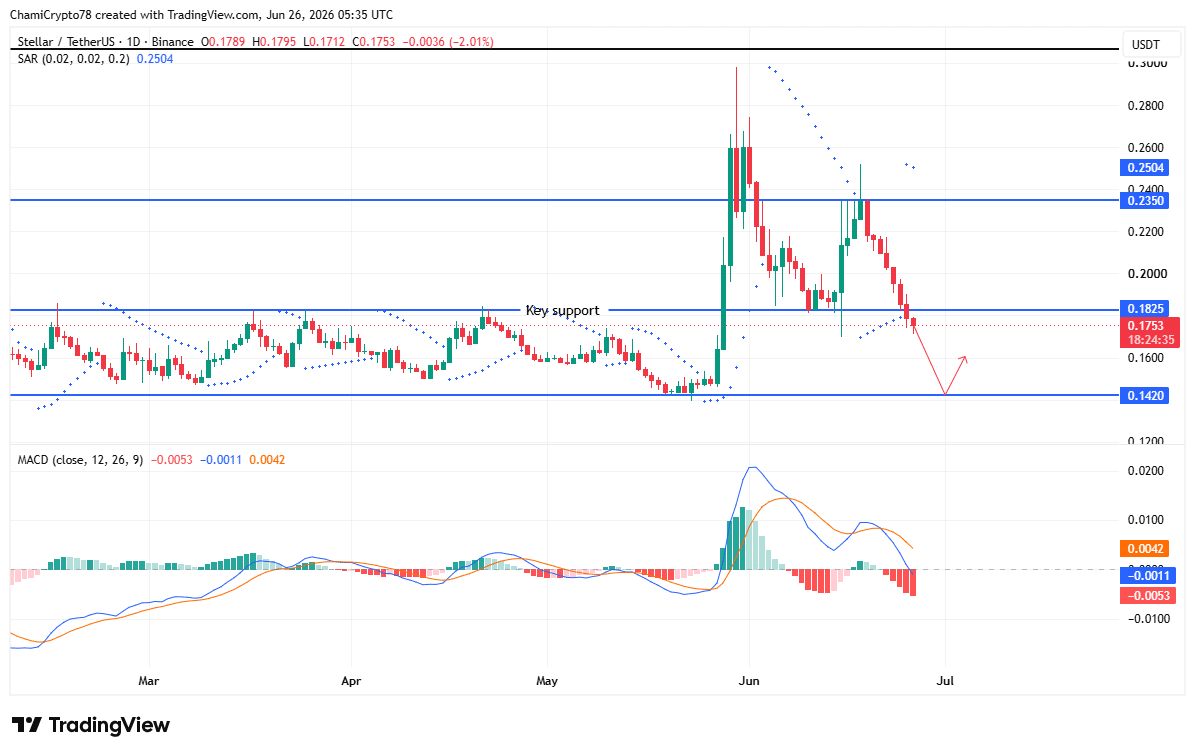
XLM broke below a key horizontal support after failing to preserve its previous trading structure, leaving the $0.142 demand zone as the next major downside objective.

Price remained below the descending trendline, reflecting continued bearish control across the chart.

The MACD maintained a bearish crossover as the histogram stayed below the zero line, showing downside pressure had not eased despite recent consolidation attempts.

In addition, the Parabolic SAR dots continued forming above the candles, reinforcing the existing downtrend instead of signaling a reversal.

Buyers repeatedly attempted to reclaim lost ground, yet every recovery stalled beneath former support, strengthening the bearish structure.

If sellers maintained control, XLM could continue drifting toward $0.142 before any meaningful recovery attempt emerged.
Source: TradingView

Buyers weakened as bears retained control

Momentum indicators continued favoring sellers as XLM approached another important technical test.

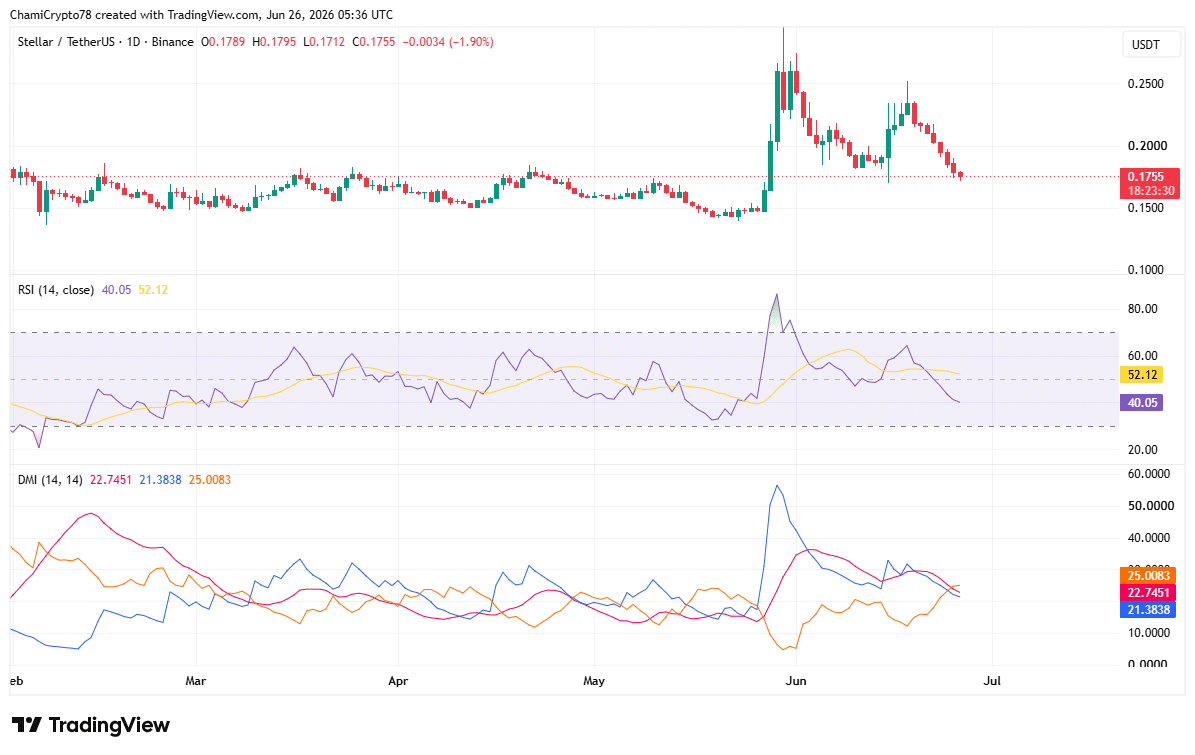
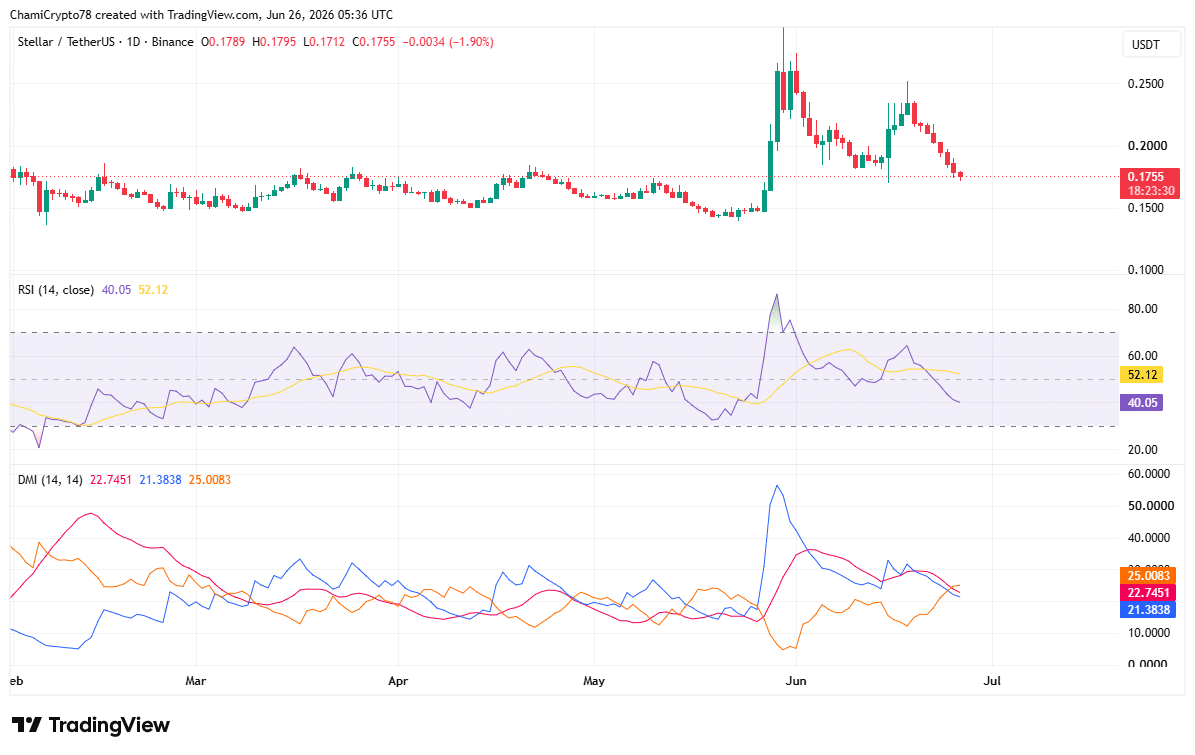
The Relative Strength Index (RSI) fell to 34.42, placing it close to oversold territory after extended selling pressure reduced buying participation.

Although the reading suggested the decline had become increasingly stretched, it had not yet confirmed a reversal signal.

Meanwhile, the Directional Movement Index (DMI) showed -DI at 25 remained well above +DI at 21.38, while the ADX climbed to 22.75.

This combination indicates the prevailing bearish trend retained enough strength to remain intact.

Buyers would likely need to reclaim control of directional movement before sentiment improves. Otherwise, weakening participation could continue supporting another leg lower toward the next demand area.
Source: TradingView

Is XLM headed for the $0.142 demand zone?

Current market conditions favored another decline toward the $0.142 demand zone before buyers could attempt a sustained recovery.

Selling pressure dominated both Spot order flow and price structure, while trend indicators continued supporting the bearish outlook.

However, if buyers successfully defend the demand zone and momentum indicators stabilize, XLM could begin building a recovery from that area. Until those signals emerge, the downside scenario remains the more probable outcome.


Final Summary

  • Rising trading activity failed to slow XLM’s decline as sellers continued controlling the market.
  • XLM could test the $0.142 demand zone before buyers attempt a meaningful recovery.

Kripto yang Sedang Tren

Pertanyaan Terkait

QWhat is the current trading price of Stellar (XLM) and its daily percentage change as mentioned in the article?

AThe token traded at around $0.1514 at press time, reflecting a 7.85% daily loss.

QWhat is the next major downside price target for XLM according to the technical analysis?

AThe $0.142 demand zone is identified as the next major downside objective for XLM.

QWhat do key momentum indicators like the MACD and Parabolic SAR suggest about the market trend for XLM?

AThe MACD maintained a bearish crossover and the histogram stayed below the zero line. The Parabolic SAR dots continued forming above the candles, both reinforcing the existing downtrend and indicating continued bearish control.

QWhat does the Relative Strength Index (RSI) reading imply about XLM's current market condition?

AThe RSI fell to 34.42, placing it close to oversold territory, which suggests the decline has become increasingly stretched but has not yet confirmed a reversal signal.

QAccording to the article's conclusion, what is the more probable short-term outcome for XLM's price?

AThe downside scenario, with XLM declining towards the $0.142 demand zone, remains the more probable outcome until buyers show successful defense of that zone and momentum indicators stabilize.

Bacaan Terkait

Probabilitas Menembus di Bawah 50%: Apakah RUU Clarity Tahun Ini Tidak Ada Harapan?

Tajuk: Probabilitas Turun di Bawah 50%: Clarity Act Tidak Akan Terjadi Tahun Ini? Rangkuman: Rencana awal untuk menandatangani undang-undang Clarity Act pada 4 Juli telah gagal, dan jendela peluang untuk disahkannya sebelum pemilihan paruh waktu semakin menyempit. Meskipun sebagian besar pekerjaan Senat dapat dilanjutkan di balik layar selama reses musim panas, prosedur di DPR saat ini mandek. Rancangan undang-undang ini, yang bertujuan menciptakan kerangka kerja regulasi federal pertama untuk pasar aset digital AS, telah disetujui oleh DPR. Senat juga telah meloloskan rancangan tersebut di tingkat komite dan memasukkannya ke kalender legislatif. Namun, perdebatan dan perbedaan pendapat antara partai politik terkait ketentuan pendapatan stablecoin, pengecualian tanggung jawab pengembang DeFi, serta detail penegakan hukum dan etika masih belum terselesaikan. Ini menyebabkan negosiasi tertutup pecah awal Juni. Meskipun ada faktor positif seperti perubahan sikap Asosiasi Sheriff Kabupaten AS dari oposisi menjadi netral terhadap klausul tertentu, hambatan utama tetap ada. Menurut data dari Polymarket, probabilitas Clarity Act ditandatangani menjadi undang-undang tahun ini hanya 49%, mencerminkan sikap pasar yang berhati-hati namun masih berharap. Analis dari Jefferies menilai bahwa jika undang-undang ini berhasil disahkan, hal itu akan mendorong adopsi aset digital yang lebih luas oleh lembaga keuangan tradisional. Sebaliknya, penundaan akan memperpanjang ketidakpastian regulasi. Waktu tiga minggu yang efektif setelah Kongres kembali bersidang pada 13 Juli menjadi periode kritis yang akan menentukan nasib undang-undang ini pada tahun 2026.

Foresight News1j yang lalu

Probabilitas Menembus di Bawah 50%: Apakah RUU Clarity Tahun Ini Tidak Ada Harapan?

Foresight News1j yang lalu

Trading

Spot

Artikel Populer

Cara Membeli XLM

Selamat datang di HTX.com! Kami telah membuat pembelian Stellar (XLM) menjadi mudah dan nyaman. Ikuti panduan langkah demi langkah kami untuk memulai perjalanan kripto Anda.Langkah 1: Buat Akun HTX AndaGunakan alamat email atau nomor ponsel Anda untuk mendaftar akun gratis di HTX. Rasakan perjalanan pendaftaran yang mudah dan buka semua fitur.Dapatkan Akun SayaLangkah 2: Buka Beli Kripto, lalu Pilih Metode Pembayaran AndaKartu Kredit/Debit: Gunakan Visa atau Mastercard Anda untuk membeli Stellar (XLM) secara instan.Saldo: Gunakan dana dari saldo akun HTX Anda untuk melakukan trading dengan lancar.Pihak Ketiga: Kami telah menambahkan metode pembayaran populer seperti Google Pay dan Apple Pay untuk meningkatkan kenyamanan.P2P: Lakukan trading langsung dengan pengguna lain di HTX.Over-the-Counter (OTC): Kami menawarkan layanan yang dibuat khusus dan kurs yang kompetitif bagi para trader.Langkah 3: Simpan Stellar (XLM) AndaSetelah melakukan pembelian, simpan Stellar (XLM) di akun HTX Anda. Selain itu, Anda dapat mengirimkannya ke tempat lain melalui transfer blockchain atau menggunakannya untuk memperdagangkan mata uang kripto lainnya.Langkah 4: Lakukan trading Stellar (XLM)Lakukan trading Stellar (XLM) dengan mudah di pasar spot HTX. Cukup akses akun Anda, pilih pasangan perdagangan, jalankan trading, lalu pantau secara real-time. Kami menawarkan pengalaman yang ramah pengguna baik untuk pemula maupun trader berpengalaman.

492 Total TayanganDipublikasikan pada 2024.12.13Diperbarui pada 2026.06.02

Cara Membeli XLM

Diskusi

Selamat datang di Komunitas HTX. Di sini, Anda bisa terus mendapatkan informasi terbaru tentang perkembangan platform terkini dan mendapatkan akses ke wawasan pasar profesional. Pendapat pengguna mengenai harga XLM (XLM) disajikan di bawah ini.

活动图片