This Double Bottom Formation Could Send XRP Soaring To $2.5

bitcoinistPublished on 2025-12-22Last updated on 2025-12-22

Abstract

A crypto analyst has identified a double bottom pattern forming in XRP’s price chart, suggesting a potential bullish reversal after months of bearish pressure. Despite trading 50% below its all-time high, XRP is showing signs of momentum shift, with the Relative Strength Index (RSI) indicating exhausted selling pressure. The token recently reclaimed a key support level after a fakeout, reinforcing the double bottom structure. Analysts predict that if market conditions remain favorable, XRP could rally toward the $2.3–$2.5 range in the coming weeks. Another expert notes resilience in XRP market structure, with strong support levels and weakening seller momentum, suggesting a potential climb to $2.60 or even $3 if key resistance is broken.

XRP may be setting up for a major breakout as technical indicators flash a familiar bullish signal. A crypto analyst has identified a developing Double Bottom pattern, suggesting that the cryptocurrency’s downtrend may be ending. Although the price performance over the past months has been muted and slow, now trading about 50% below its all-time high, analysts still believe that the altcoin is primed for a sharp upside move to $2.5.

XRP Double Bottom To Fuel Surge To $2.5

Crypto market analyst Niels has indicated that XRP is showing signs of a potential bullish turnaround, which could trigger a price surge to $2.5. In his X post, he presented a fresh technical analysis, highlighting a Double Bottom formation beginning to take shape on the chart. The chart also shows that the price has reacted strongly twice from the same demand area, reinforcing the Double Bottom setup.

Notably, the Double Bottom is emerging after months of sustained downside pressure, during which the altcoin remained firmly locked in a bearish structure. The decline initially kept its consolidation around $2. However, it recently pushed the token as low as $1.8 before price action stabilized and recovered modestly above $1.9.

Source: Chart from Niels on X

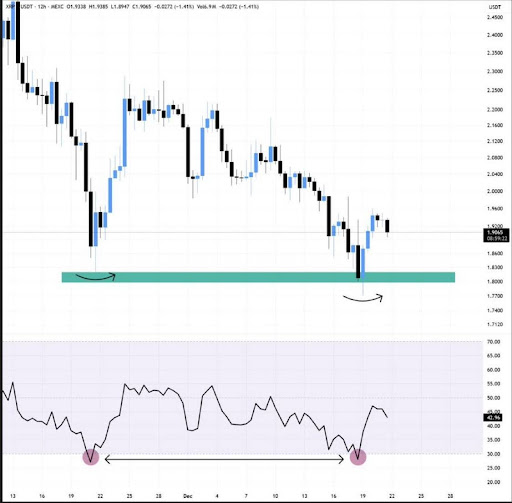
In his analysis, Neils also highlighted that momentum indicators are starting to align with a possible trend reversal for the token. According to him, XRP’s Relative Strength Index (RSI) has already bottomed out, suggesting that selling pressure may be exhausted. He also observed that price action is showing encouraging signs, which often precedes a stronger upside move when supported by market momentum.

Niels further explained that the altcoin recently dipped below a key support zone before quickly reclaiming it, forming a fakeout. With momentum improving and support holding, the analyst predicts that it could soon rally toward the $2.3 to $2.5 range over the next few weeks if market conditions remain favorable.

XRP Shows Signs Of Strength Despite Ongoing Downtrend

In a separate analysis, crypto market expert Broke Doomer highlighted that XRP remains in a downward trend but is showing signs of resilience. He noted that support levels continue to hold strong with buyers stepping in at each level, preventing a steeper decline.

Doomer also stated that seller momentum is weakening as the token maintains a strong low, suggesting that any upside shift could happen quickly. Given its growing strength and steady price recovery, the analyst has predicted that the cryptocurrency could first target a reclaim of $2.20 before moving toward $2.60.

His chart also points to a higher target for XRP if it can cross $2.6, forecasting a potential rise back toward $3. If this happens, it would represent a roughly 56% increase from its price of $1.92 at the time of writing.

XRP trading at $1.91 on the 1D chart | Source: XRPUSDT on Tradingview.com

Related Questions

QWhat technical pattern is identified by analyst Niels that could signal a bullish turnaround for XRP?

ANiels identified a Double Bottom pattern forming on the XRP chart, which is a bullish reversal signal.

QWhat is the price target for XRP if the Double Bottom pattern leads to a breakout, according to the analyst?

AThe analyst predicts that XRP could rally toward the $2.3 to $2.5 range if the breakout occurs and market conditions remain favorable.

QWhich momentum indicator does Niels mention has bottomed out, suggesting that selling pressure may be exhausted?

ANiels mentioned that XRP's Relative Strength Index (RSI) has bottomed out, indicating that selling pressure may be exhausted.

QDespite the ongoing downtrend, what signs of resilience is XRP showing according to Broke Doomer?

ABroke Doomer noted that XRP is holding strong support levels with buyers stepping in at each level, and seller momentum is weakening, which shows resilience.

QWhat is the higher price target for XRP if it manages to cross the $2.6 level, as forecasted in the article?

AIf XRP crosses the $2.6 level, the article forecasts a potential rise back toward $3, which would be a roughly 56% increase from its current price of $1.92.

Related Reads

Nominal Price vs. Real Value: The Gold Content of a $100,000 Bitcoin

A recent Galaxy study reveals that when measured in 2020 dollar purchasing power, Bitcoin's actual value is approximately $99,848—falling short of the nominal $100,000 milestone. This discrepancy highlights how inflation has quietly reshaped the significance of fiat-denominated price levels, a particularly relevant issue in the current institution-driven market cycle. Inflation has significantly eroded the dollar's purchasing power, with current nominal prices needing to be multiplied by 0.8 to reflect 2020 values. This means $100,000 in 2025 is equivalent to about $80,000 in 2020 terms. To match the 2020 purchasing power of $100,000, Bitcoin's nominal price would need to reach nearly $125,000—a level approached during this cycle's peak, fueling debate. For institutional investors like pension funds, real returns—adjusted for inflation—are the true measure of value, representing a key test for Bitcoin's maturation as a macro asset. Complicating matters, CPI data has become less reliable, with the Bureau of Labor Statistics halting releases in 2025 due to funding issues, making real-value assessments more difficult. Market reactions reflect this value divergence. After October's peak, Bitcoin fell 30%, and U.S. spot Bitcoin ETF assets under management dropped from $169.5 billion to $120.7 billion by early December. However, on-chain data shows underlying strength, with Bitcoin's realized capitalization reaching a new all-time high of $1.125 trillion, indicating strong long-term holder conviction. Future trends depend on several factors: monetary policy changes restoring nominal value, persistent inflation making new highs economically hollow, or ETF-driven demand pushing prices past inflation-adjusted resistance. Citi projects a base case of $143,000 by 2026, with an optimistic scenario above $189,000, largely dependent on ETF flows. Ultimately, inflation has turned Bitcoin's fiat milestones into moving targets. Ironically, while often hailed as an inflation hedge, Bitcoin's symbolic price achievements are themselves being rewritten by inflation. The market should focus not on nominal numbers but on the actual purchasing power behind them—the true indicator of Bitcoin entering a new era.

比推29m ago

Nominal Price vs. Real Value: The Gold Content of a $100,000 Bitcoin

比推29m ago

Trading

Spot
Futures

Hot Articles

Discussions

Welcome to the HTX Community. Here, you can stay informed about the latest platform developments and gain access to professional market insights. Users' opinions on the price of XRP (XRP) are presented below.

活动图片