1. BTC weak sorting
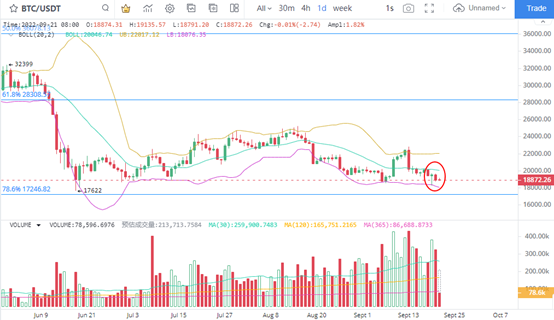
BTC maintained a weak consolidation trend, while the decline was expanding, which means that the decline after the recent large-scale decline has not ended, and the break down at a critical time may still occur. Considering that the Federal Reserve is about to raise interest rates, the interest rate increase point will be announced in the early morning of Thursday Beijing time, so BTC has been at the node of the change. At the same time, BTC has reached below $19000. If short-term support works, there will be results in the short term. Considering that BTC has accumulated a large number of firm offers during its large-scale operation in the past three months, and the trading volume in the past two weeks has increased significantly, which means that the reliability of large-scale decline is very high. Therefore, risk avoidance is the most noteworthy area in the short term.
2. Increase in BTC loss
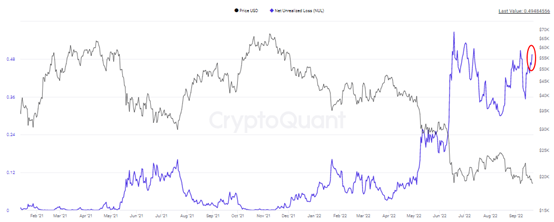
The proportion of unconfirmed losses of BTC continued to grow, reaching a high of 0.494 on September 20, which is very close to the previous high of 0.566. In other words, with the slow expansion of the decline, the unrecognized losses did not decrease. After the number of loss making investors continued to accumulate increased, the possibility of BTC breaking down continued to grow. At present, there are also signs that there are bulls taking the initiative to enter the market. Therefore, we can only wait for BTC loss plate to cut meat during the price decline to reduce the selling pressure.
3. Increase of BTC long position explosion
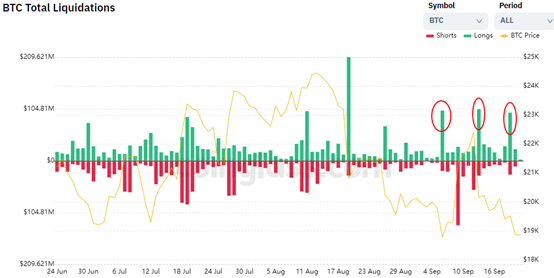
Recently, the size of the long position explosion of BTC has remained at a high level, especially the one-day position explosion. On September 6, 13, and 19, BTC's long positions could reach $101 million, $104 million, and $97 million. That is to say, the funds of the bulls that have been blown out recently frequently hit $100 million, which indicates that the probability of BTC price maintaining a weak position is very high. After the bulls broke out frequently, the support was weakened, and the BTC price was on the verge of further breaking.
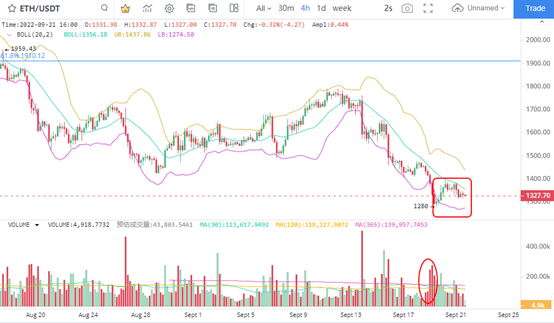
4. ETH rebounds fruitlessly
The short-term rebound of ETH was fruitless. In the short-term 4-hour K chart, the price still fell from the middle track position of the Bollinger line, which means that the downward trend is still continuing. This shows that even though some investors bought ETH during the price decline, they still failed to reverse the price decline. Recently, the overall trading volume has not performed well. ETH in the 4-hour K line chart has been lower than the middle track of the Bollinger Line for the ninth consecutive trading day. It can be seen that this price retreat may last at least until the Federal Reserve sends out the signal of interest rate increase.
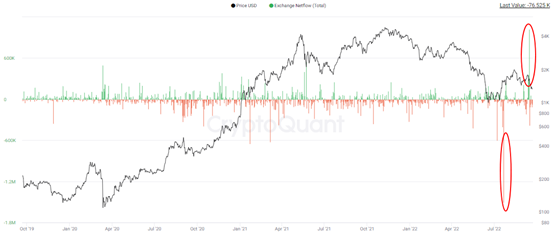
5. The flow direction of ETH exchange continues to reverse
Although the outflow of ETH from the exchange continued for a long time, the recent flow of ETH shows signs of reversing this trend. With the recent substantial growth of the number of ETH flowing into the exchange, the decline of ETH prices may be affected. On September 14, the number of ETH flowing into the exchange increased significantly to a high of 1.021 million, and net flow into the exchange for five consecutive trading days. Different from the 1.5 million ETHs that accumulated out of the exchange on July 21, the trend of ETH flowing into the exchange needs to be further confirmed. However, looking back on the performance of ETH flowing into the exchange in the past two years, this time, the number of ETH flowing into the exchange on a single day is the largest, and we can pay attention to the market impact.