
Since bottoming at $17,700 on June 18, Bitcoin has been trading within a relatively tight band, with $25,100 marking the upper limit of this channel.
Although the past week or so saw BTC print six consecutive daily green closes, higher-than-expected CPI inflation data, released on September 13, ended the upward momentum. On that day, BTC swung 13% to the downside to bottom at $19,800.
Price uncertainty is the dominant narrative as macro pressures continue to weigh heavy on the market leader. According to the Options 25 Delta Skew and Options Volume Put/Call Ratio, this has played out as a willingness to go long, even on minor signs of price recovery. However, the overall sentiment is bearish.
Options 25 Delta Skew
The Options 25 Delta Skew metric looks at the ratio of put vs. call options expressed in terms of Implied Volatility (IV). Puts being the right to sell a contract at a specific price and calls being the right to buy.
For options with a specific expiration date, 25 Delta Skew refers to puts with a delta of -25% and calls with a delta of +25%, netted off to arrive at a data point. In other words, this is a measure of the option’s price sensitivity given a change in the spot Bitcoin price.
The individual periods refer to option contracts expiring 1 week, 1 month, 3 months, and 6 months from now, respectively.
Below 0 indicates calls are pricer than puts. This situation has occurred only six times this year. During Bitcoin’s recent bottoming, traders scrambled for puts and then reverted to calls at the local top.
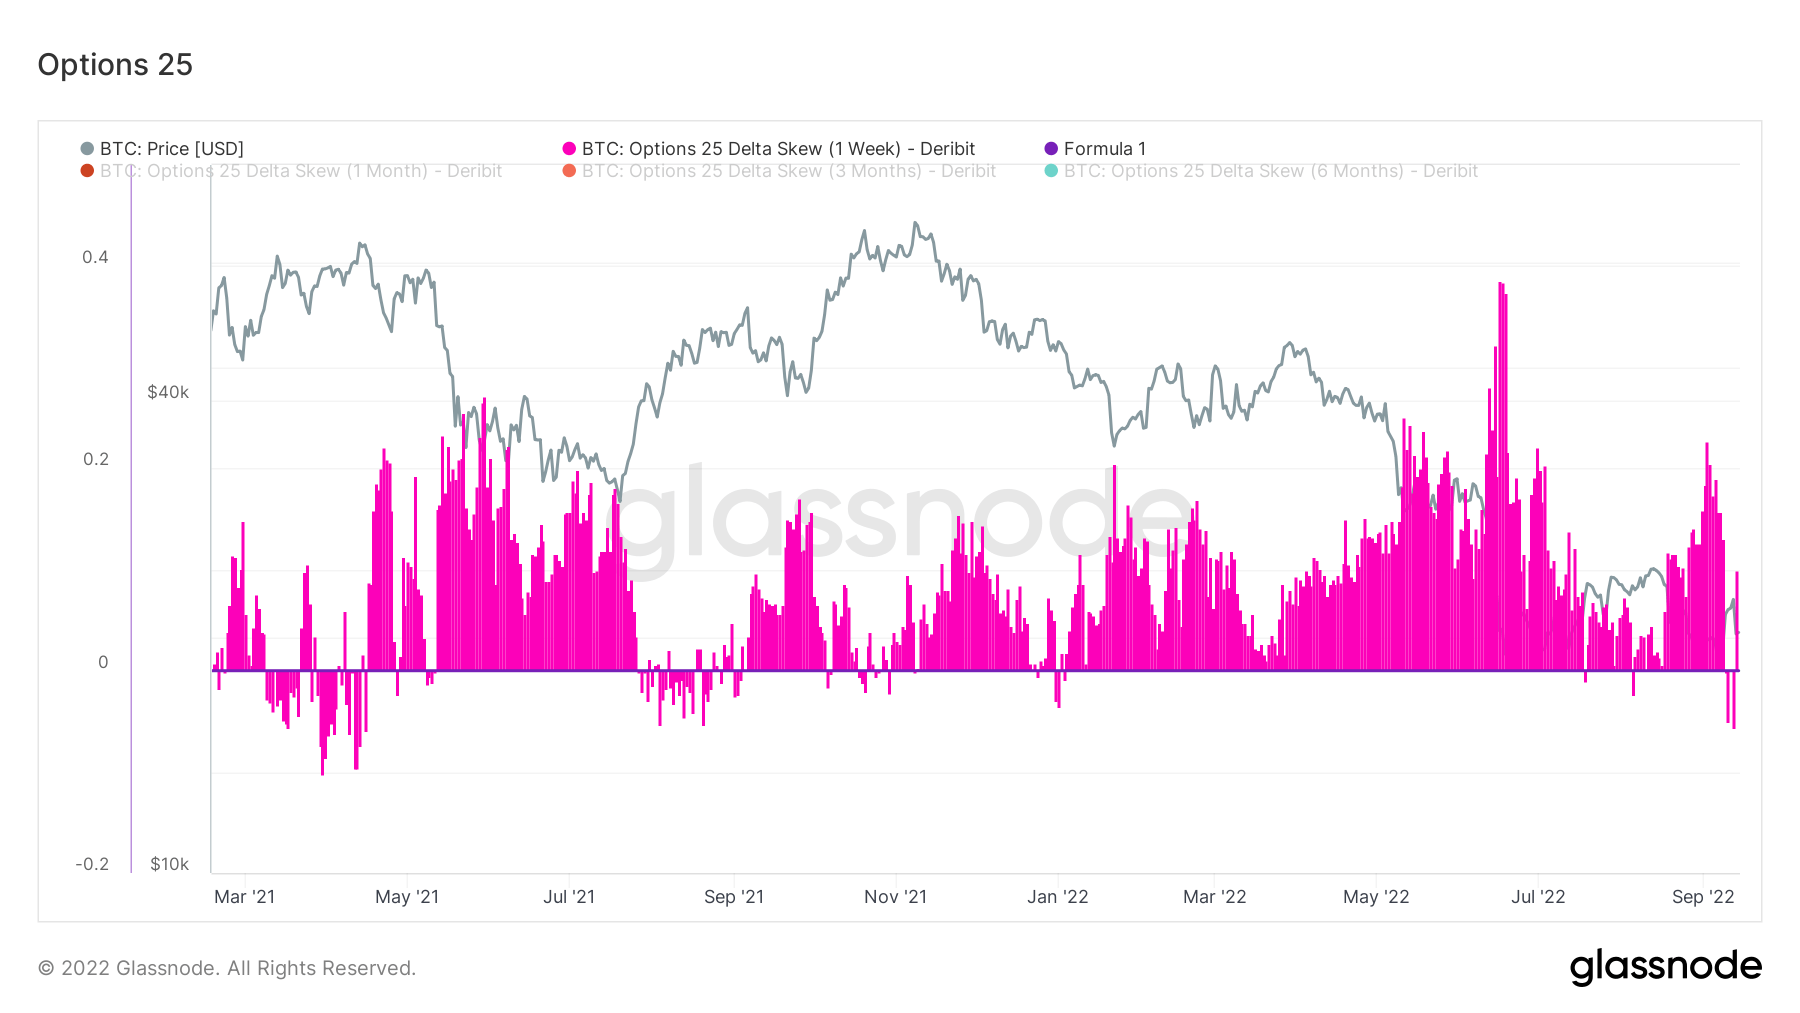
BTC Price vs. Options Skews (Source: Glassnode.com)
This changeable behavior can be explained by a long, drawn-out bear market prompting traders to react quickly, even on minor indications of price recovery.
In recent weeks, as Bitcoin flitted above and below $20,000, traders have struck for calls, to go long, on four occasions, only for the market to move against them. Consecutive back-to-back calls have not happened since the end of last year.
Options Volume Put/Call ratio
The Options Volume Put/Call Ratio shows the put volume divided by the call volume traded in options contracts in the last 24 hours. It is used to gauge the general mood of the market.
The chart below shows a heavy skew towards puts, as evidenced by sharp increases in the ratio during instances of price bottoming.
This suggests bearish sentiment is firmly embedded. But similar to the Options 25 Delta Skew data, traders will go long on signs of price recovery.
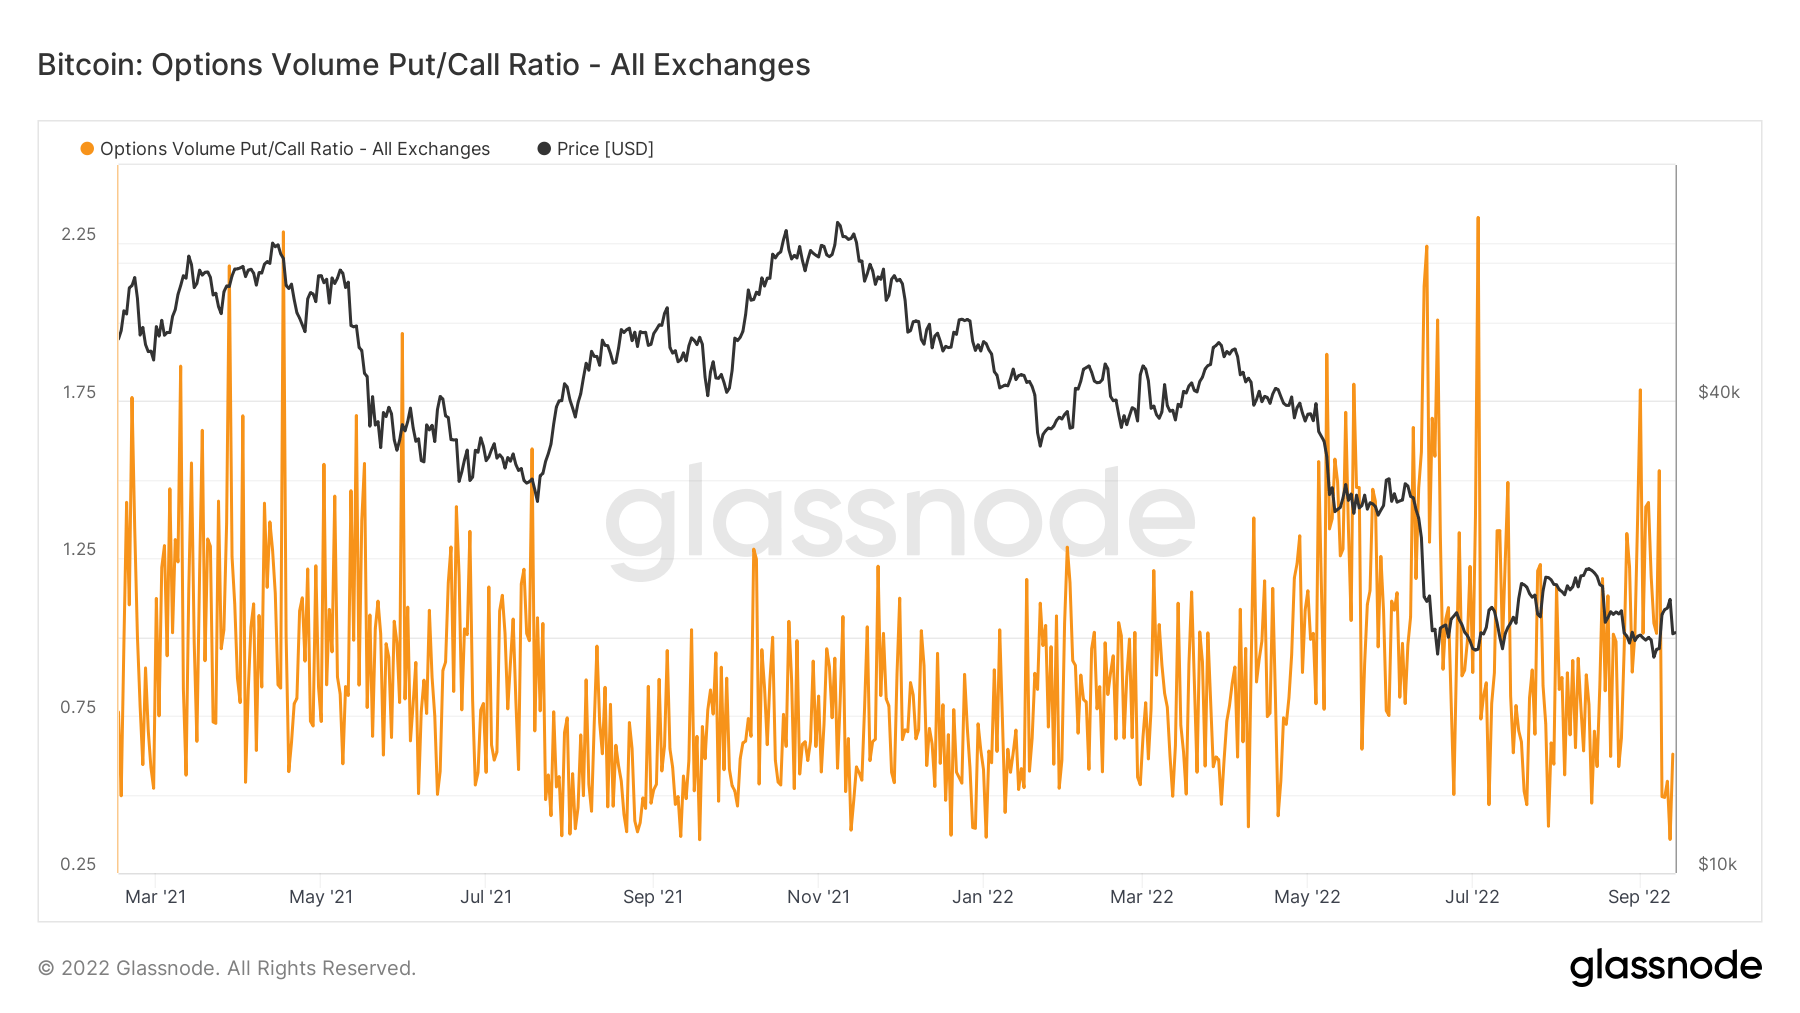
Bitcoin: Options Volume Put/Call Ration (Source: Glassnode.com)