Are We in the Start of Bull Market? Leveraging On-Chain Data to Contextualize Key Market Trends

BitcoinistPublié le 2022-08-16Dernière mise à jour le 2022-08-17

Résumé

On top of that, if the historical record is any guide, market sentiment has rarely been this negative. None of these trends seem structural or new, which suggests an appealing setup for long-term holders.

Following the crypto market crash in the second quarter of 2022, the crypto market posted a partial recovery in July: The Bitwise 10 Large Cap Crypto Index rose 37%, after falling 63% in Q2. Although the broader market outlook is still uncertain, we see some signs of selling pressure exhausting itself.

In this column, we leverage on-chain data on bitcoin (BTC) and ethereum (ETH), the two largest crypto assets, to evaluate where we are in the crypto market cycle. Specifically, we examine three key trends: geographical flows, positioning by investor type, and market sentiment.

Crypto is especially suitable for such explorations because all transactions are recorded pseudonymously in a public ledger (aka the blockchain). By combining blockchain transaction data with additional datasets, it is possible to infer critical market trends in a way that is not possible for more traditional asset classes.

Geographical Flows: The Crypto Accumulation Trend by North American Entities—A Defining Trend of the Past Bull Market—Dipped and Stalled in Q2 2022

One amazing thing about on-chain data is that you can determine, to a reasonable degree, the geographical source of buying and selling pressure in crypto. By crossing blockchain transaction data, known addresses belonging to specific crypto entities, and web traffic flows, one can estimate which countries or regions are sending and receiving assets.

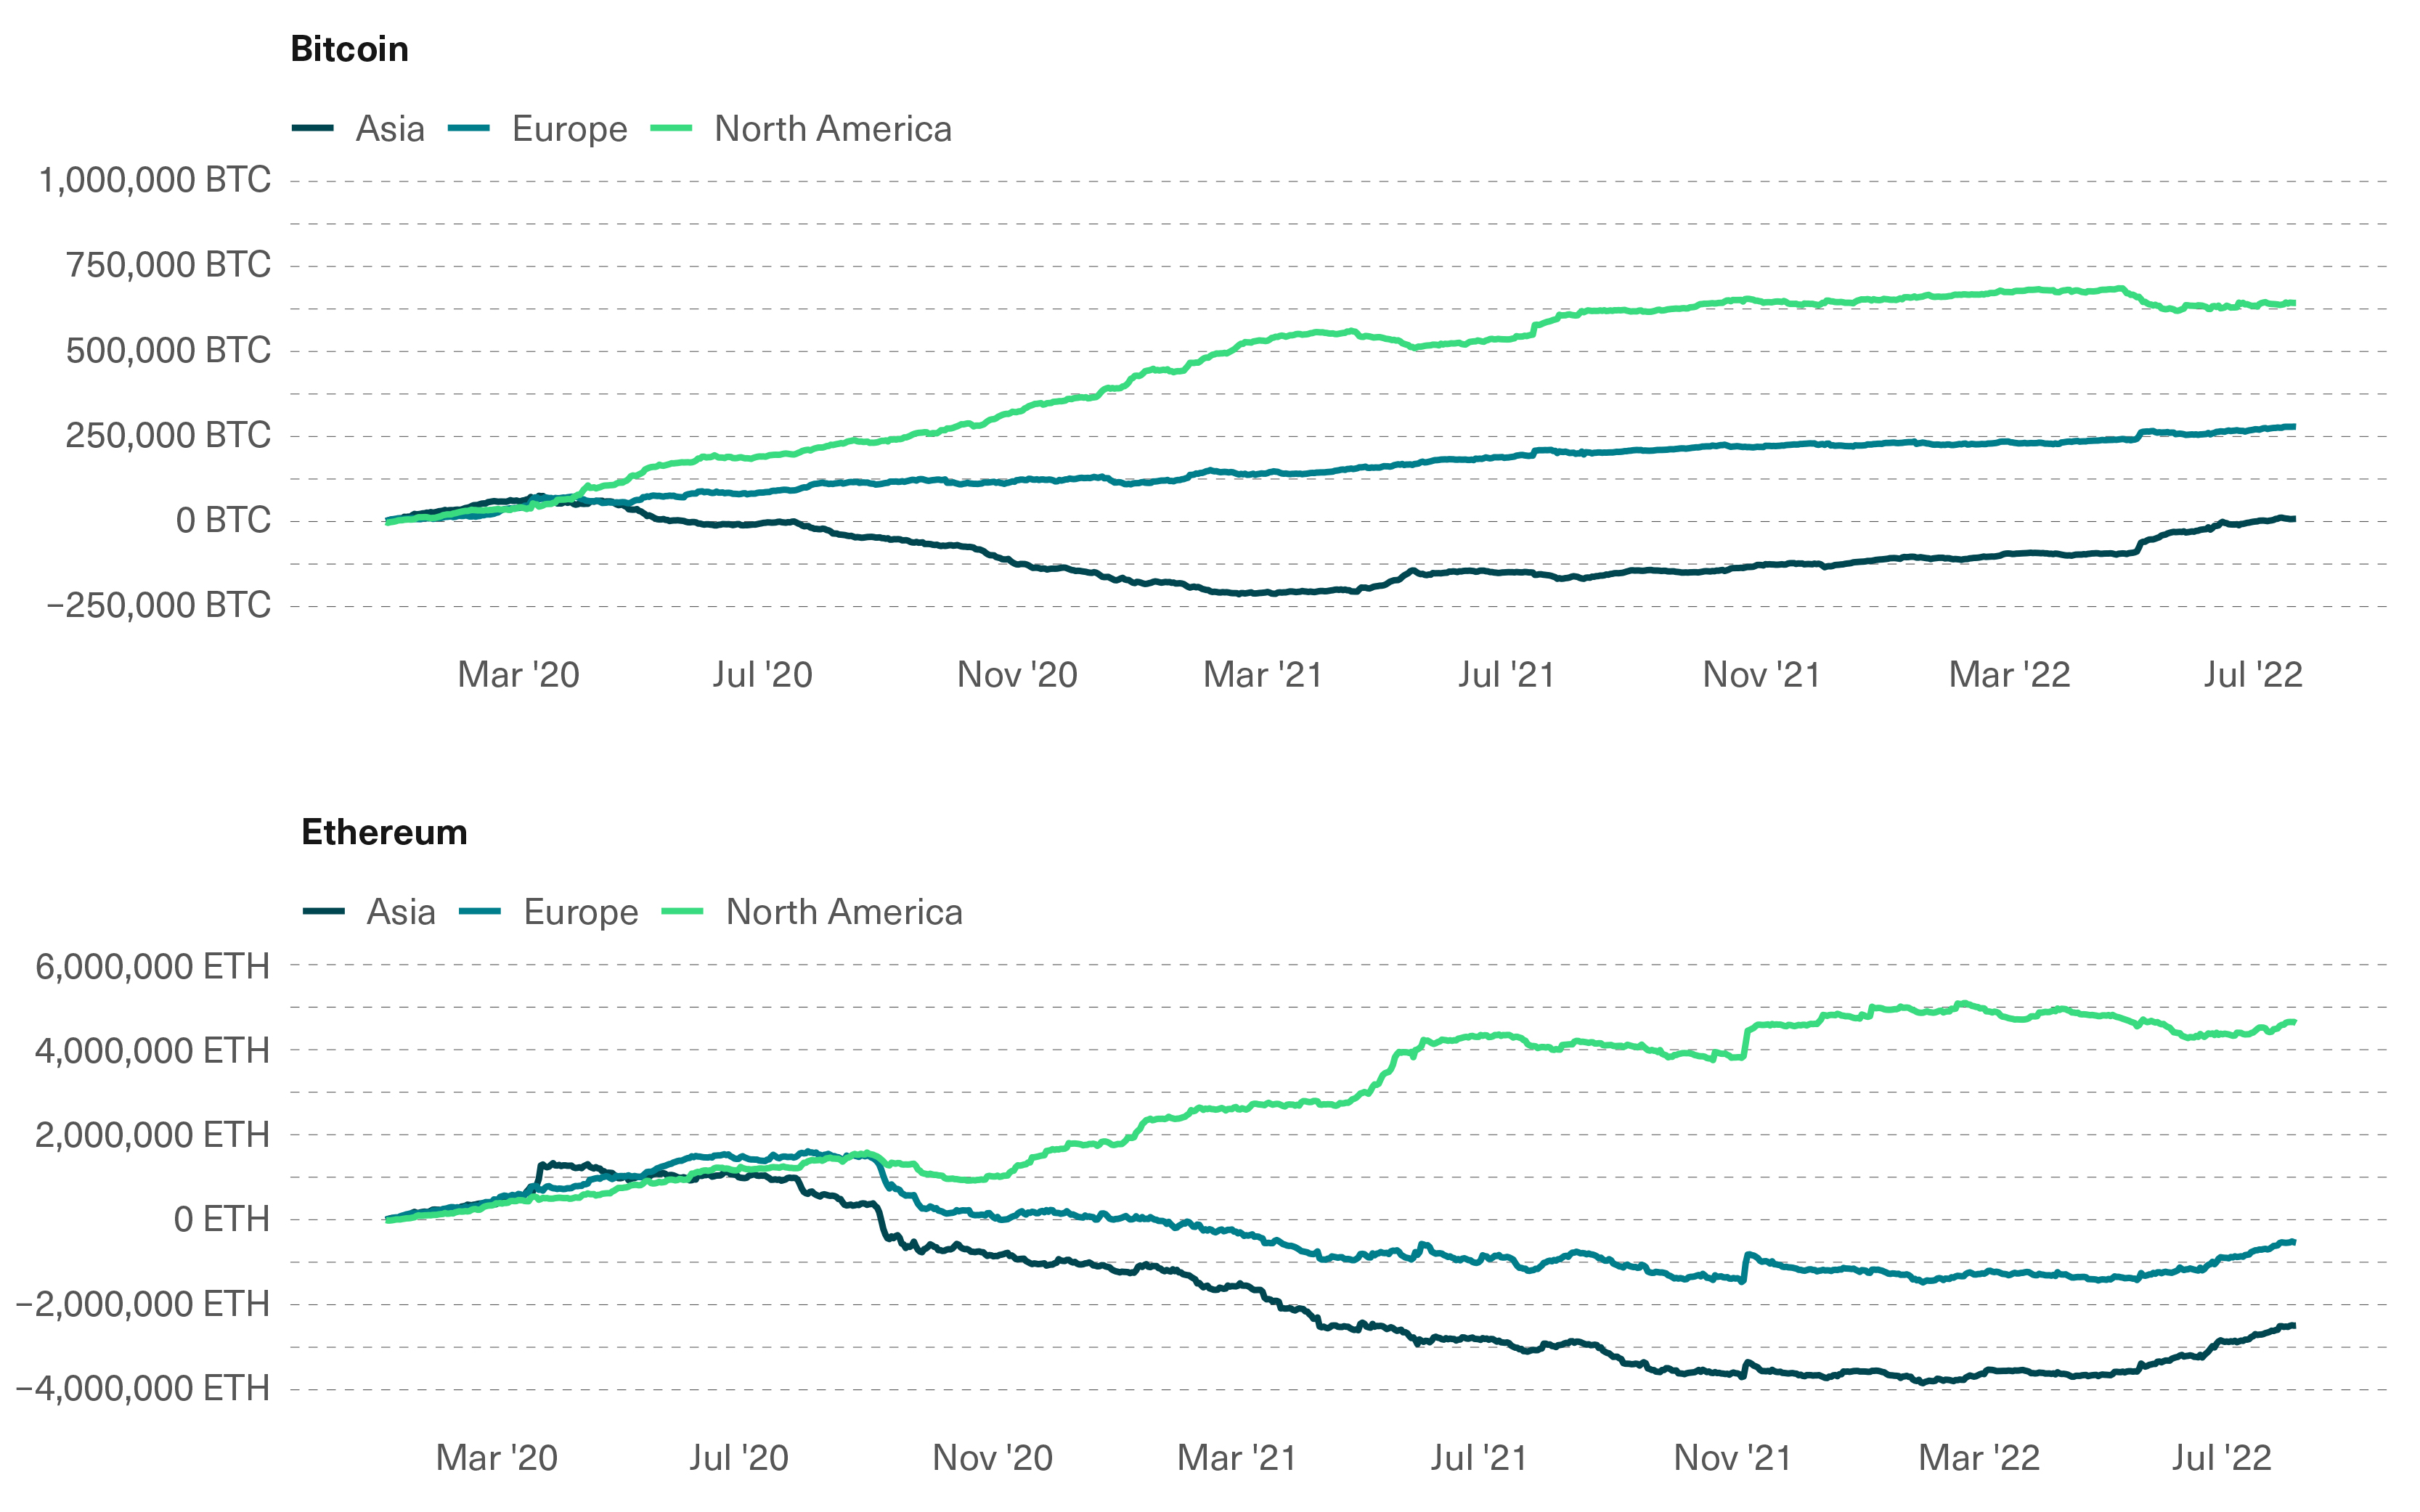
A defining trend of the crypto bull market over the past couple of years has been the accumulation of crypto by North American (mainly U.S.) entities, with outflows coming from the Asian markets. According to Chainalysis’ data, between January 1, 2020 and November 9, 2021, when the crypto market reached its all-time high, the net flow into North American entities was north of 645,000 BTC and 4.5 million ETH, over 3% of the total outstanding supply of each asset.

However, as the chart below shows, this trend has not only tapered off since then but also slightly reversed during last quarter’s crypto crash. Since May, when the market deterioration became more acute, the cumulative net flow into North American entities decreased by as much as 9.6% and 9.9% for BTC and ETH respectively, while the same metric for Asian and European entities was by and large on the rise. This is consistent with evidence from key players: Just two days ago, Coinbase, the leading North American crypto exchange, reported that a majority of Q2 trading volume took place in offshore exchanges, while the share of total crypto market capitalization held on its platform dipped from 11.2% in Q1 to 9.9% in Q2.

North American Entities Recorded Crypto Outflows in Q2 While Asian and European Ones Continued to Show Inflows

Bitcoin (top chart) and ethereum (bottom chart) cumulative net flows for select regions. Data in native units from January 1, 2020 to July 25, 2022.

Source: Bitwise Asset Management with data from Chainalysis

Positioning by Investor Type: Outflows From Larger Entities, Inflows Into Smaller Ones

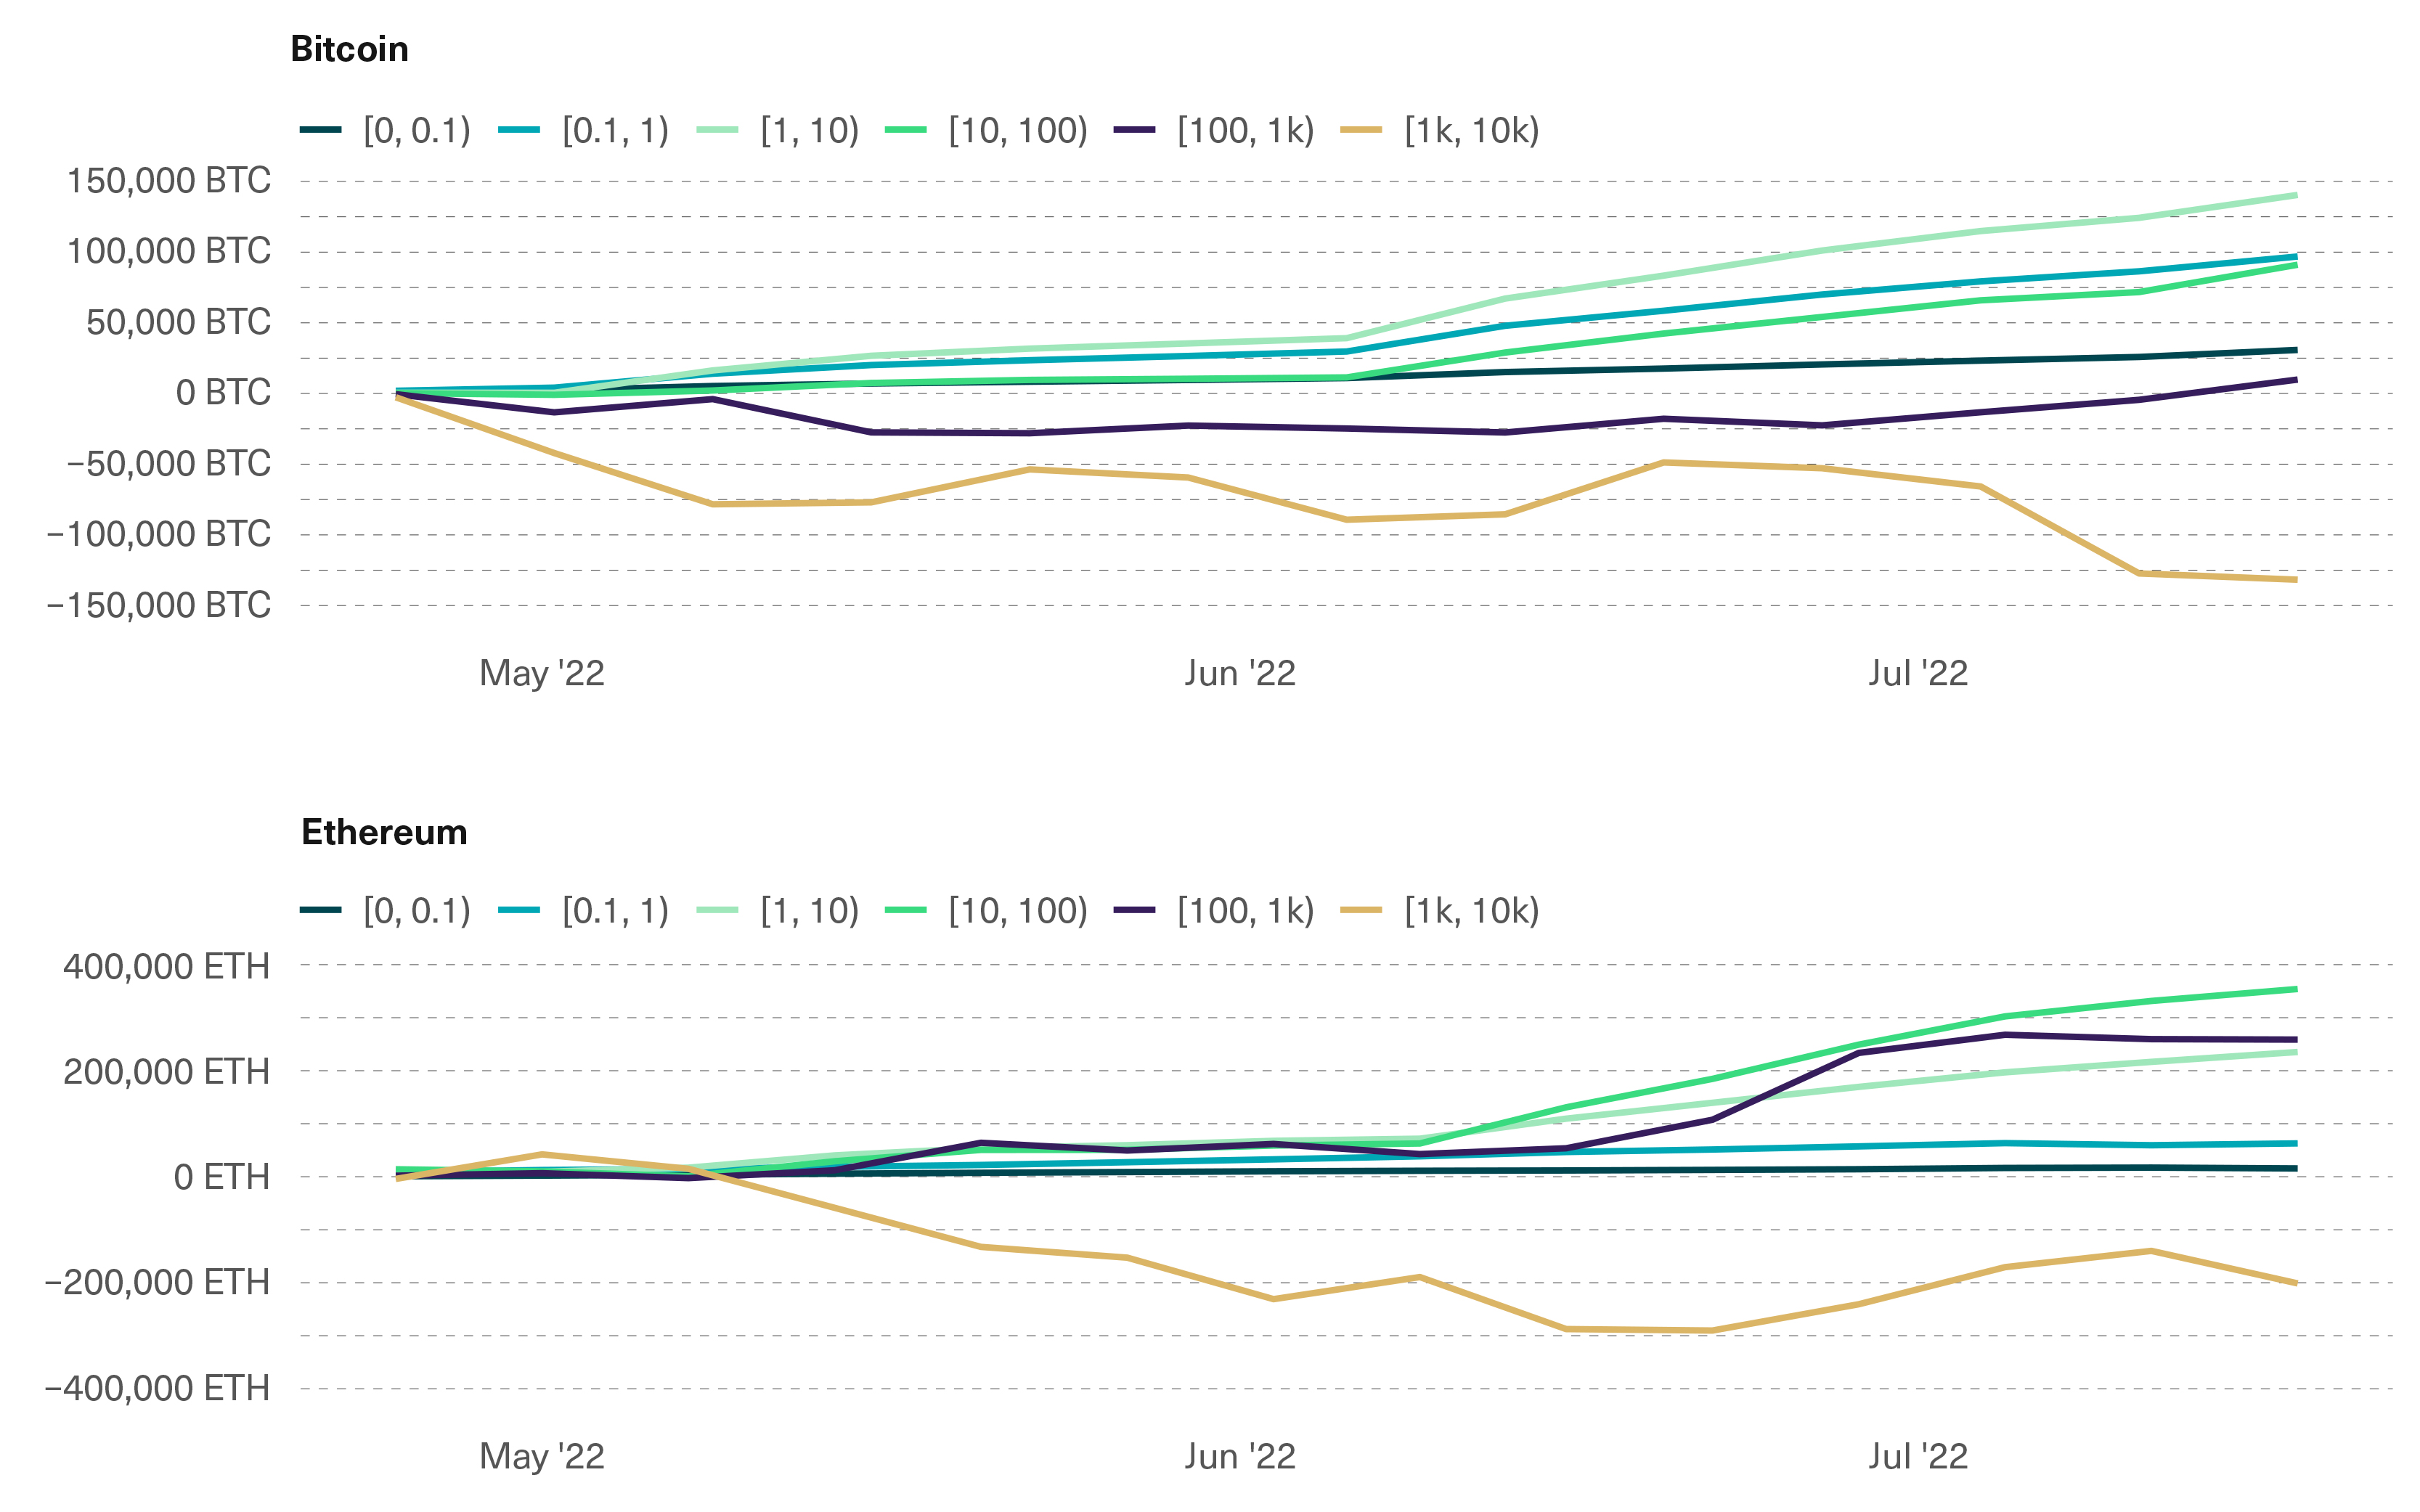
Another way to slice and dice blockchain data is to cluster it into entities by the size of their crypto holdings. 

Zooming in on entities with relatively low turnovers (to capture “investors” vs. “traders”), we can see the accumulated flows into entities that hold between 0 and 0.1 BTC or ETH, between 0.1 and 1, and so on. In this section, we’ll be focusing on entities that have a relatively low turnover, which are more likely to be investors instead of traders, and will exclude the entities with extremely large holdings, which are more likely to be exchanges.

As crypto prices started to tank more sharply in May, larger entities have been registering outflows while relatively smaller entities have been seeing inflows. The trend is stronger for BTC than for ETH: Since May, smaller investors have accumulated about 2% of the total BTC supply but less than 0.5% of the total ETH supply.


This trend also marks a pause from the crypto bull market of the last two years, in which larger entities drove the lion’s share of crypto accumulation. The fact that this trend has been stronger for BTC than for ETH confirms our perception that the latter has been gaining traction in larger investors’ minds, as excitement around the upcoming Merge upgrade and ethereum’s scalability roadmap continues to build.

Outflows From Exchanges and Other Larger Entities Into Smaller Entities

Bitcoin (top chart) and ethereum (bottom chart) accumulation trends by investor size. Data in native units from May 1 to July 18, 2022.

Source: Bitwise Asset Management with data from Chainalysis

Market Sentiment: Implied Unrealized Losses Suggest the Worst Is Behind Us

The third and final analysis to consider is implied unrealized profit, or the current profit or loss of every held position, in entities that hold bitcoin or ethereum.

This metric has historically been most useful as a contrarian indicator: The higher the percentage of holders sitting on unrealized losses, the more likely the market is close to capitulation, and therefore the more favorable the timing for potential buyers is. As the old stock market proverb goes: “Buy at the roar of cannons and sell at the sound of trumpets.”

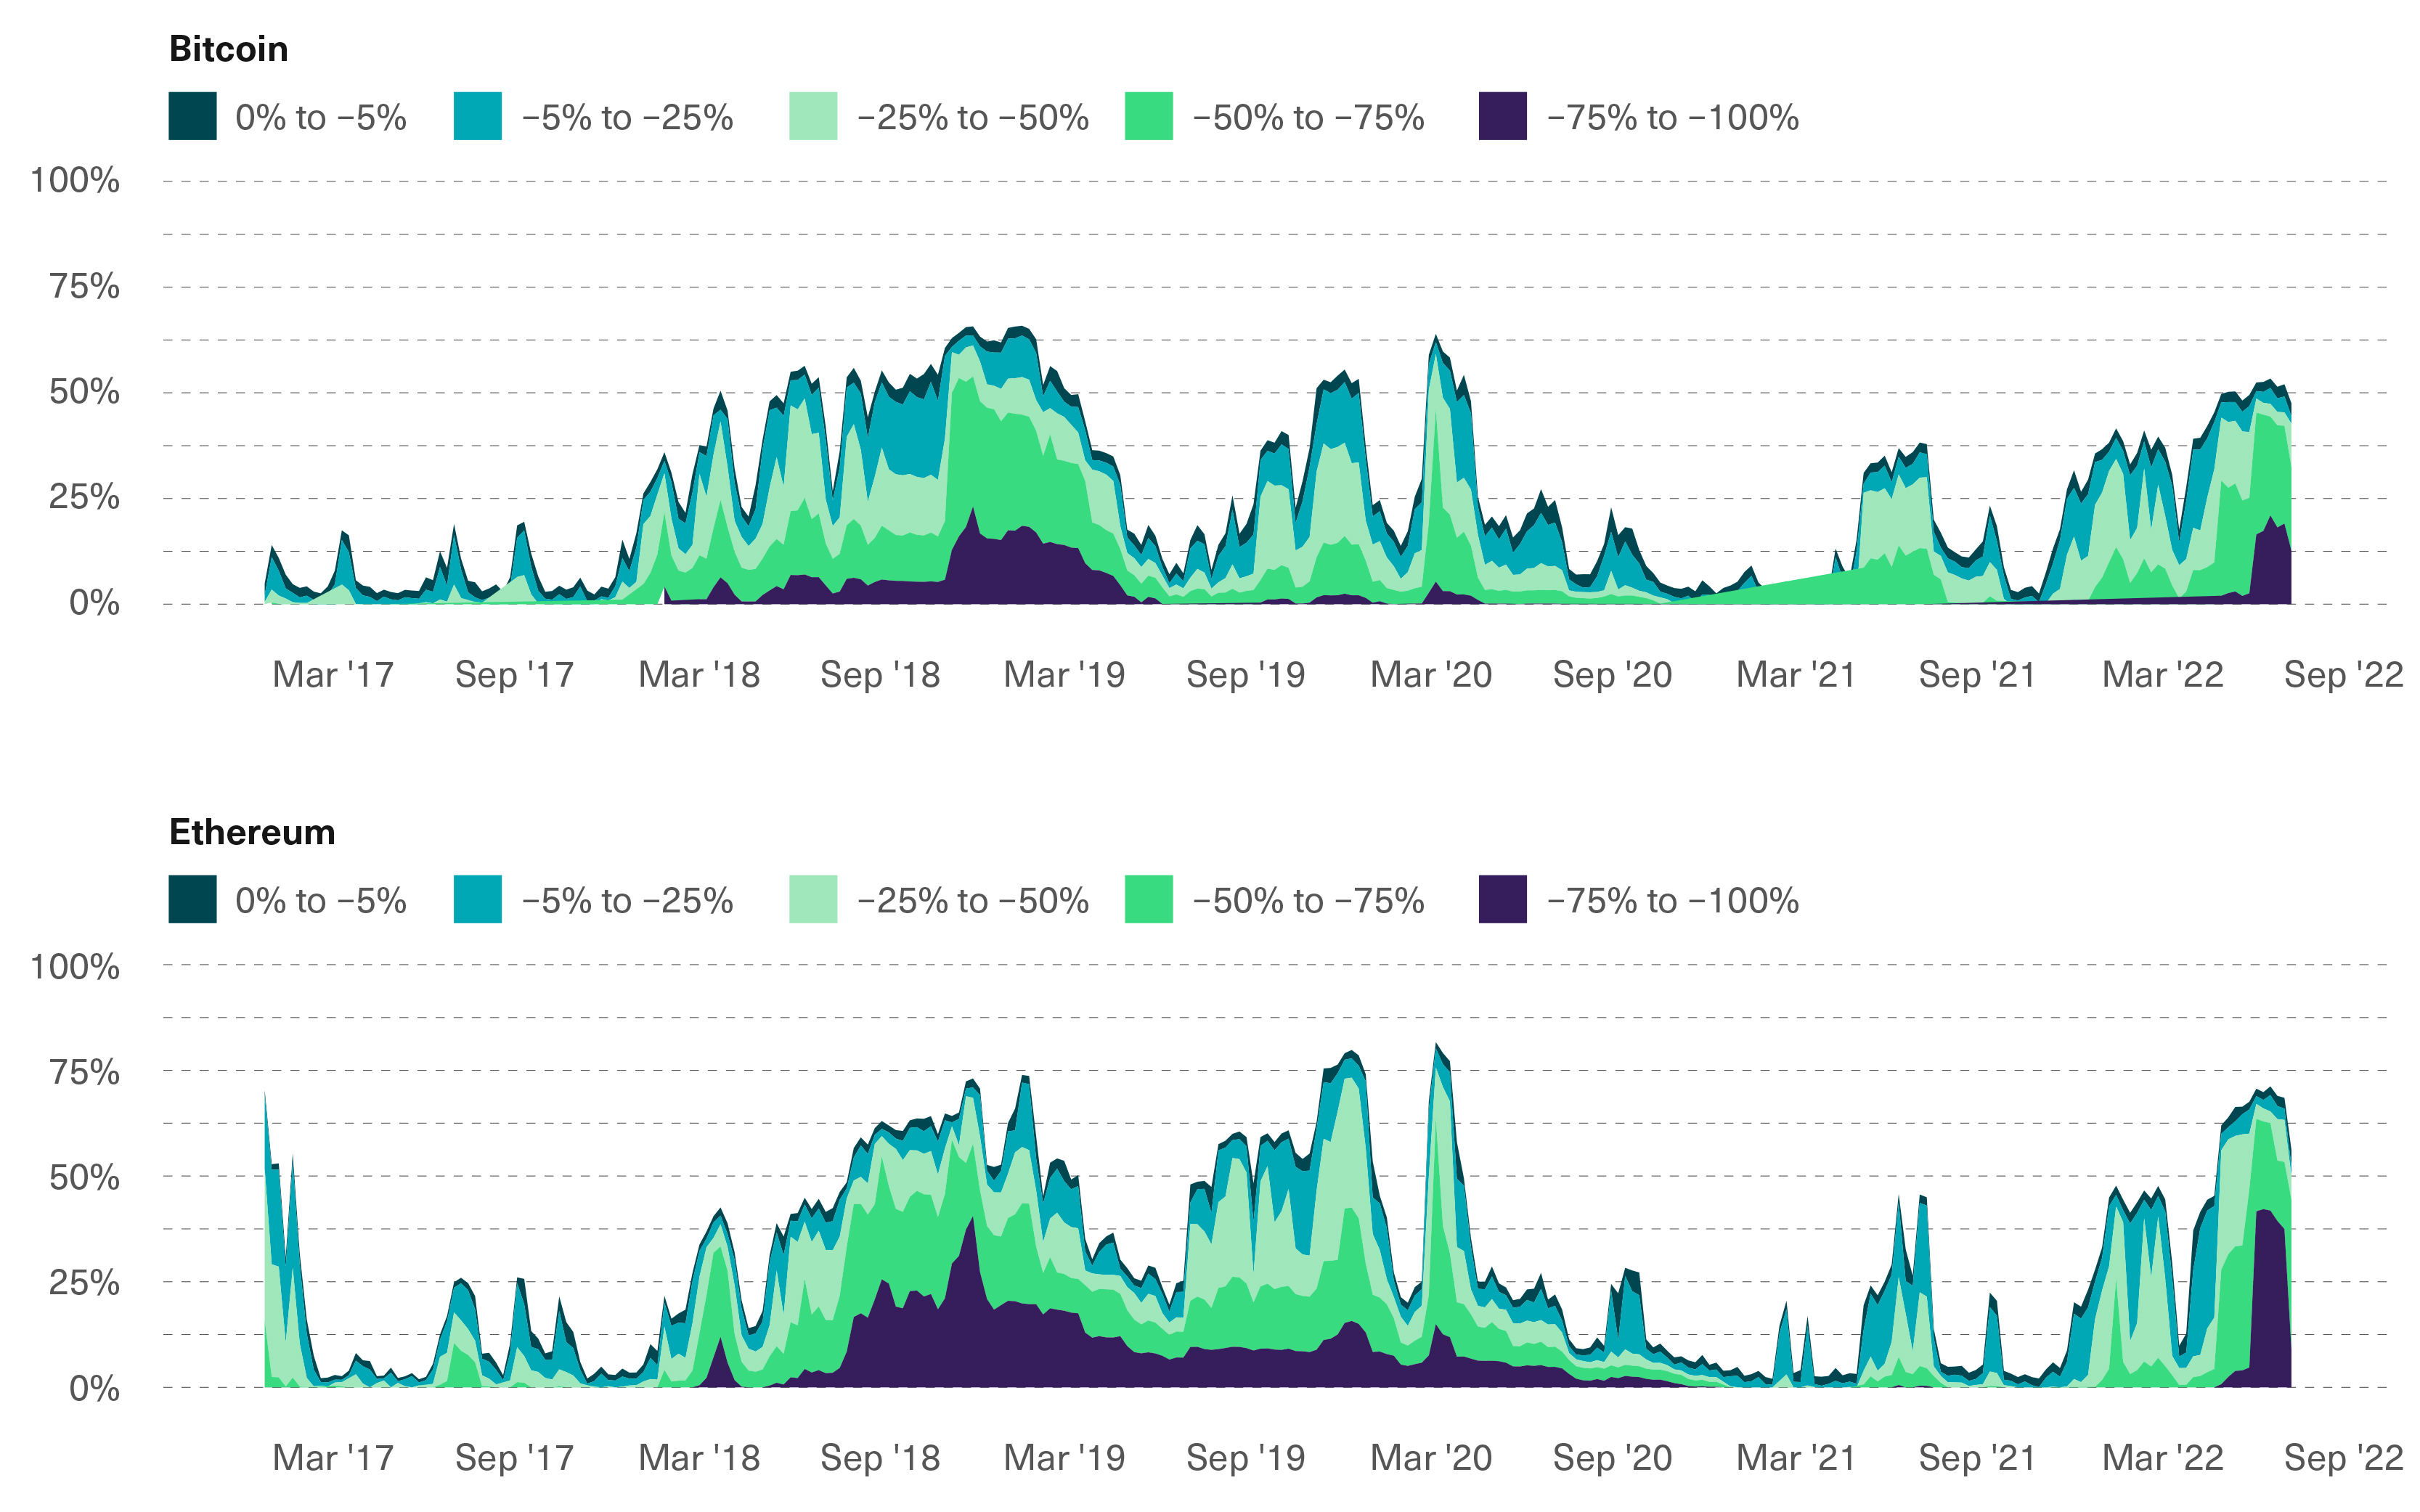
The chart below shows the percentage of the total BTC and ETH supply that sits on an unrealized loss, broken down by the loss size (between 0 and -5%, between -5% and -25%, and so on).

The percentage of the supply currently in losses stands at a tad below 50% for BTC and at over 60% for ETH. Perhaps even more striking, the entities that are currently sitting on losses of over 50% currently comprise over 40% for both BTC and ETH.

Since 2017, such levels were seen only during the March 2020 COVID crash, the 2019 correction, and the worst parts of the 2018 crypto winter. Although further demand shocks cannot be ruled out, the historical record suggests when investor sentiment is this negative, reversals can happen relatively quickly.

The Percentage of Supply Currently in the Red Has Parallels Only to the 2018 Crypto Winter and the COVID Crisis

Bitcoin (top chart) and ethereum (bottom chart) percentage of supply by ranges of unrealized loss. Data from January 1, 2020 to July 18, 2022.

Source: Bitwise Asset Management with data from Chainalysis

Conclusion

It is worth noting that on-chain data is not perfect. Geographical flows can be estimated only for entities that are known to be based in a specific location, and are based on web traffic data, which might not reflect actual transaction volume accurately. Positioning by investor type cannot be detected for entities that don’t touch the blockchain directly, and no blockchain analytics company fully describes the behavior of all entities that hold crypto assets. On top of that, market sentiment indicators make assumptions about each holder’s cost basis that might not be fully accurate.

Having said that, we think this data can provide key context in understanding where crypto markets sit. The key trends highlighted (geographical flows, changes in investor position by size, and market sentiment) suggests that dips in accumulation appetite by larger investors, mostly North America-based, likely were influential in the Q2 crypto market crash. On top of that, if the historical record is any guide, market sentiment has rarely been this negative. None of these trends seem structural or new, which suggests an appealing setup for long-term holders.

Lectures associées

La Corée du Sud se prépare à réguler les transferts cryptographiques transfrontaliers dans le cadre d'un nouveau système

La Corée du Sud prévoit d'inclure les entreprises de fintech dans son nouveau cadre d'autorisation pour les transferts d'actifs virtuels, qui doit entrer en vigueur en décembre. Cette décision suit l'introduction d'une période de grâce de six mois dans l'amendement de la loi sur les transactions de change. À partir de décembre, les entreprises effectuant des transferts transfrontaliers via des actifs virtuels devront s'enregistrer auprès du ministère de l'Économie et des Finances et déclarer leurs transactions via le système de déclaration des changes coréen. Ce cadre réglementaire vise à placer ces transferts sous surveillance officielle, les autorités ayant constaté que de nombreux transferts d'actifs numériques échappaient au contrôle des changes, présentant des risques de blanchiment d'argent et d'activités criminelles. Initialement, les règles s'appliquaient principalement aux plateformes d'échange de cryptomonnaies. Cependant, les régulateurs sud-coréens envisagent désormais d'élargir le champ des entités éligibles pour inclure des acteurs non traditionnels, comme les fintechs, si elles peuvent effectuer ces transferts de manière efficace. Le ministère et la Banque de Corée collaborent avec les acteurs du secteur pour finaliser les règles d'application avant le lancement en décembre. Cette initiative s'inscrit dans un contexte plus large de renforcement de la supervision des actifs numériques par la Corée du Sud, qui travaille également sur une réglementation pour les produits financiers tokenisés.

TheNewsCryptoIl y a 1 h

La Corée du Sud se prépare à réguler les transferts cryptographiques transfrontaliers dans le cadre d'un nouveau système

TheNewsCryptoIl y a 1 h

Microsoft identifie un nouveau logiciel malveillant ciblant les adresses de portefeuille et les clés privées

En février 2026, Microsoft Threat Intelligence a découvert une nouvelle campagne de malware ciblant les cryptomonnaies, identifiée sous le nom de Trojan/CryptoBandits.A. Ce logiciel malveillant, propagé via des fichiers .lnk malveillants sur des clés USB, opère sans installer ni serveur de commande classique. Il utilise l'hôte de script Windows et une technologie ActiveX pour déployer un proxy Tor, permettant une connexion discrète aux serveurs des attaquants via un service caché Tor. Une fois installé, le malware déploie deux modules : l'un pour sa propagation et l'autre agissant comme un "clipper" et voleur d'informations. Il surveille en permanence le presse-papier pour y déceler des phrases de récupération (de 12 ou 24 mots), des clés privées Bitcoin/Ethereum et des adresses de portefeuille. Lorsqu'un utilisateur copie une adresse pour effectuer une transaction, le malware la remplace silencieusement par une adresse contrôlée par les attaquants. De plus, le malware capture des captures d'écran qu'il envoie via Tor, permettant aux cybercriminels d'évaluer les soldes et activités des victimes. Il dispose également de capacités d'exécution de code à distance et assure sa persistance via des tâches planifiées. Microsoft recommande aux organisations de désactiver l'exécution automatique, de restreindre les interpréteurs de script et les raccourcis exécutables depuis les périphériques USB, et de surveiller toute activité suspecte liée à l'exécution de JavaScript, aux proxys locaux (port 9050), ou à la surveillance du presse-papier. Cette campagne illustre l'adaptation continue des menaces à l'essor des cryptomonnaies.

TheNewsCryptoIl y a 2 h

Microsoft identifie un nouveau logiciel malveillant ciblant les adresses de portefeuille et les clés privées

TheNewsCryptoIl y a 2 h

Sans équipe commerciale, un chiffre d'affaires de 20 millions de dollars : comment Viktor, l'employé IA, a-t-il séduit 30 000 entreprises ?

Sans équipe commerciale, le produit Viktor, un « employé IA », génère 20 millions de dollars de revenus annuels auprès de plus de 30 000 entreprises. Fondé par une équipe issue de DeepMind, Viktor se présente comme un « collègue IA de niveau 3 » capable d'exécuter des tâches de bout en bout, et non un simple assistant. Son utilisation est simplifiée : via une mention @ dans Slack ou Microsoft Teams, les employés peuvent lui demander en langage naturel d'effectuer des tâches complexes, comme générer un rapport ou réaliser un rapprochement comptable, sans avoir besoin de maîtriser l'ingénierie des prompts. Le succès repose sur un modèle de croissance tiré par le produit (PLG) et une tarification basée sur la consommation de crédits pour les tâches, réduisant les coûts d'essai. Viktor permet également une automatisation proactive, exécutant des processus comme la génération de présentations en croisant plusieurs outils. Son intégration à Teams, avec 320 millions d'utilisateurs, marque une étape vers une adoption à grande échelle, mais soulève aussi des défis majeurs : la conformité dans les grandes entreprises, les risques d'erreur dus à la boîte noire des décisions de l'IA, et la nécessité de gagner la confiance via une gouvernance robuste (journaux d'audit, permissions). L'équilibre entre efficacité automatisée et contrôle restera crucial pour son adoption dans les flux métiers essentiels.

marsbitIl y a 2 h

Sans équipe commerciale, un chiffre d'affaires de 20 millions de dollars : comment Viktor, l'employé IA, a-t-il séduit 30 000 entreprises ?

marsbitIl y a 2 h

Entretien avec les cofondateurs de CoreWeave, « action liée à Nvidia » : La demande d'IA semble s'intensifier chaque jour

Interview des dirigeants de CoreWeave : La demande d'IA semble « s'intensifier » quotidiennement CoreWeave, leader des services cloud de nouvelle génération (neocloud), a récemment partagé ses perspectives sur le marché de l'infrastructure IA. Ses dirigeants, Brannin McBee et Nick Robbins, soulignent que la demande ne faiblit pas ; au contraire, elle s'accentue chaque jour, portée par l'essor des agents IA, du raisonnement et des applications d'inférence en entreprise. Ils observent un changement structurel : le goulot d'étranglement ne se limite plus aux GPU. L'attention se porte désormais sur des défis d'infrastructure plus larges : la disponibilité des centres de données (powered shells), l'approvisionnement en CPU, en mémoire HBM, en stockage, ainsi que les capacités d'exécution de la chaîne logistique. CoreWeave, qui sert des clients majeurs comme OpenAI, Anthropic et Meta, constate une demande croissante pour les CPU (notamment les futurs Vera CPU de NVIDIA) et le stockage, nécessitant une refonte des conceptions de data centers. La différenciation de CoreWeave réside dans son excellence opérationnelle, sa rapidité de déploiement et ses performances validées par des tiers. Son modèle commercial, basé sur des contrats à long terme, lui permet de protéger ses marges en répercutant les coûts des composants comme la mémoire HBM. Le déploiement à grande échelle des nouvelles plates-formes comme Vera Rubin (VR) devrait suivre un calendrier similaire à celui des systèmes GB200, avec une accélération majeure attendue en 2027. En résumé, la course à l'infrastructure IA évolue d'une simple acquisition de puces vers une capacité globale à livrer des systèmes complexes de manière fiable et à grande échelle.

marsbitIl y a 3 h

Entretien avec les cofondateurs de CoreWeave, « action liée à Nvidia » : La demande d'IA semble s'intensifier chaque jour

marsbitIl y a 3 h

Trading

Spot
Futures
活动图片