Key Takeaways
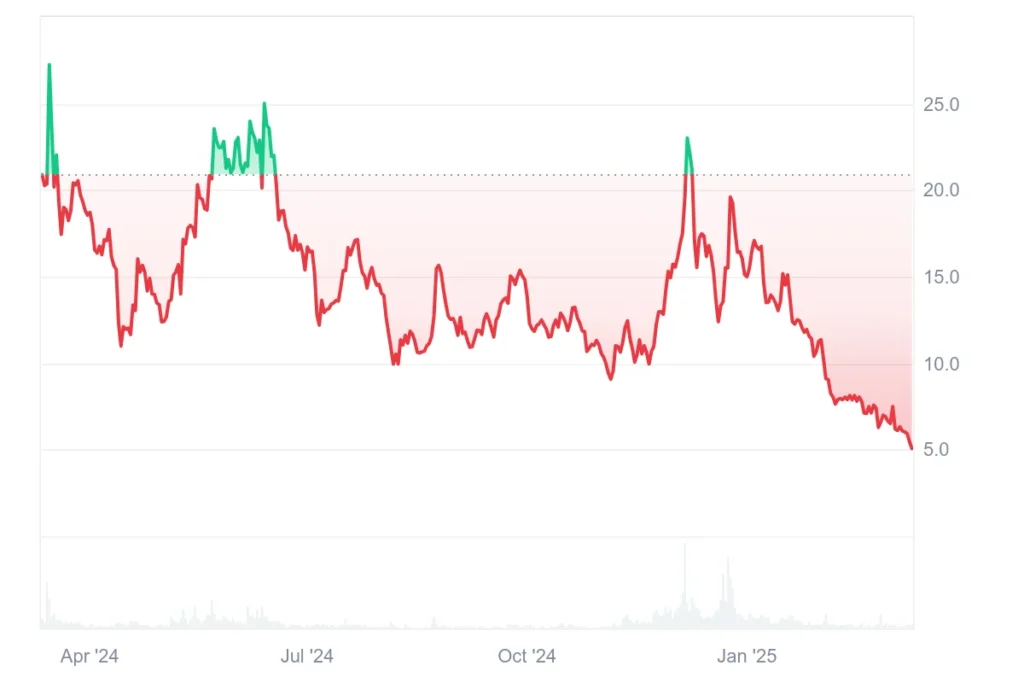
- The Livepeer streaming platform’s LPT token has dropped by more than 75% over the last year.
- LPT is part of Grayscale’s Decentralized AI Fund.
- Our Livepeer price predictions suggest LPT could reach $27.50 this year.
- Interested in buying or selling LIVEPEER LPT? Read our review of the best exchanges to buy and sell LIVEPEER LPT.
Livepeer, a platform designed to make streaming videos easier, has had a tough 12 months. Not even the news that investment firm Grayscale had added it to its Decentralized AI Fund could stop it falling by more than three-quarters since March last year.
On March 11, 2025, LPT was worth about $5.05.
Let’s examine our Livepeer price predictions, made on March 11, 2025. We will also examine the Livepeer price history and discuss what Livepeer is and does.
Livepeer Price Prediction
Here are our Livepeer price predictions, made on March 11, 2025. While we take the utmost care with our price forecasts, we do need to remind you that price predictions, especially for something as potentially volatile as cryptocurrency, can often end up being wrong
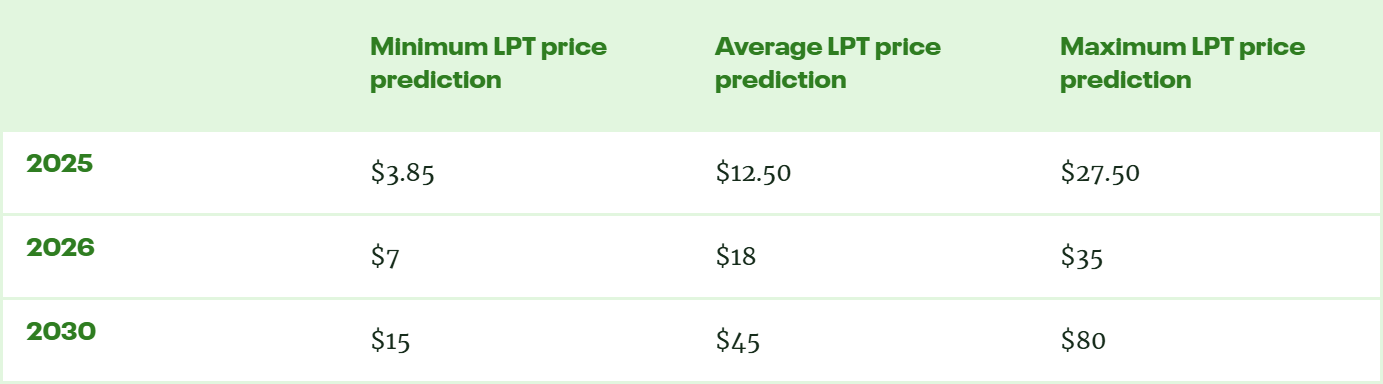
Livepeer Price Prediction 2025
LPT’s price action in 2025 will largely depend on whether it successfully reverses from the current support zone. If bullish momentum continues, it could reach the previous highs near $27.50, but failure to sustain above key levels could keep it trading between $3.85 and $12.50.
Livepeer Price Prediction 2026
By 2026, broader market conditions and adoption of Livepeer’s decentralized video streaming solutions could drive higher valuations. If LPT breaks past its previous highs, it could trade around $35.00, while a weaker uptrend may limit it to between $7 an $18.
Livepeer Price Prediction 2030
With long-term adoption and potential mainstream integration, LPT could see significant growth, pushing prices toward $80 in a strong bull cycle. However, if growth remains moderate, the price may stabilize around $45, with downside risks limiting it to $15.
Livepeer Price Analysis
LPT has been in a downtrend since peaking at $27.50, forming a WXYXZ corrective structure. The final leg is now testing key support at between $3.85 and $5.00, a historically strong demand zone.
The price remains within a descending pattern, bouncing off the lower trendline, signaling potential exhaustion in bearish momentum.
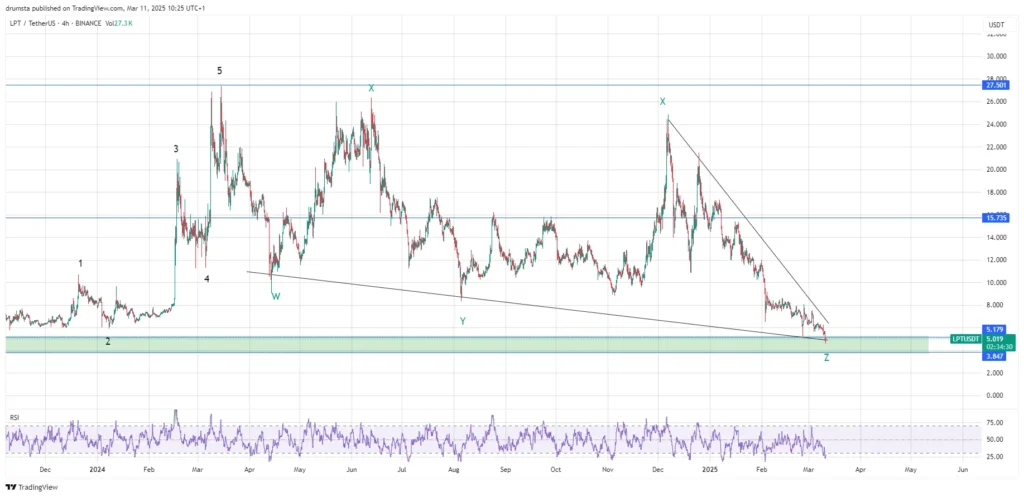
With the RSI approaching being oversold, a reversal could be imminent.
Short-term Livepeer Price Prediction
On the one-hour chart, LPT has formed a possible bottom near $5, recently touching $4.67, suggesting the correction may be complete.
Holding above $5.00 could lead to a breakout toward $7.50, with further targets at $9.45 and $12.41.
However, a drop below $3.85 would invalidate the bullish outlook. The RSI indicates buyers will step in, hinting at a potential reversal.
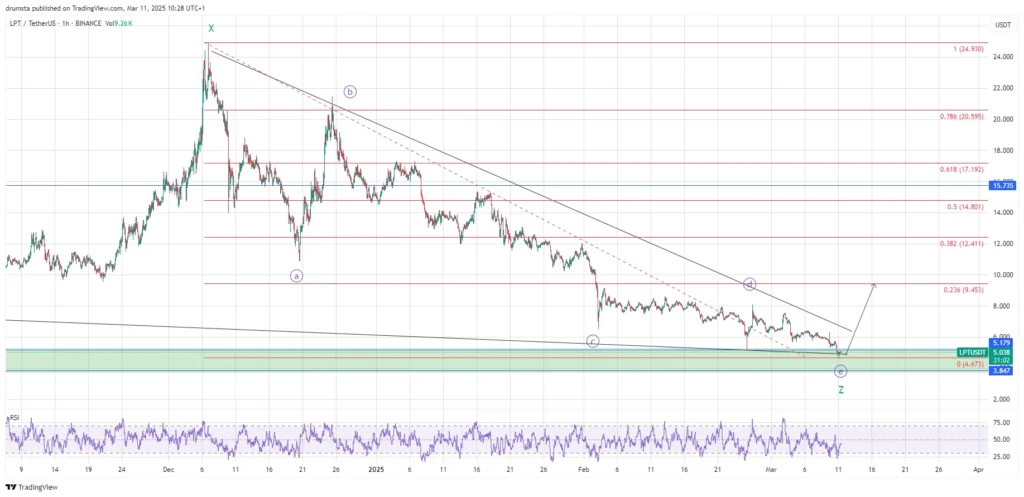
LPT is at a turning point, with a relief rally likely if it clears trendline resistance. Failure to hold support could lead to further declines, making $3.85 a key level to watch.
What happens there will determine the Livepeer price prediction for the next 24 hours.
Livepeer Average True Range (ATR): LPT Volatility
The Average True Range (ATR) measures market volatility by averaging the largest of three values: the current high minus the current low, the absolute value of the current high minus the previous close, and the absolute value of the current low minus the previous close over a period, typically 14 days.
A rising ATR indicates increasing volatility, while a falling ATR indicates decreasing volatility. Since ATR values can be higher for higher-priced assets, normalize ATR by dividing it by the asset price to compare volatility across different price levels.
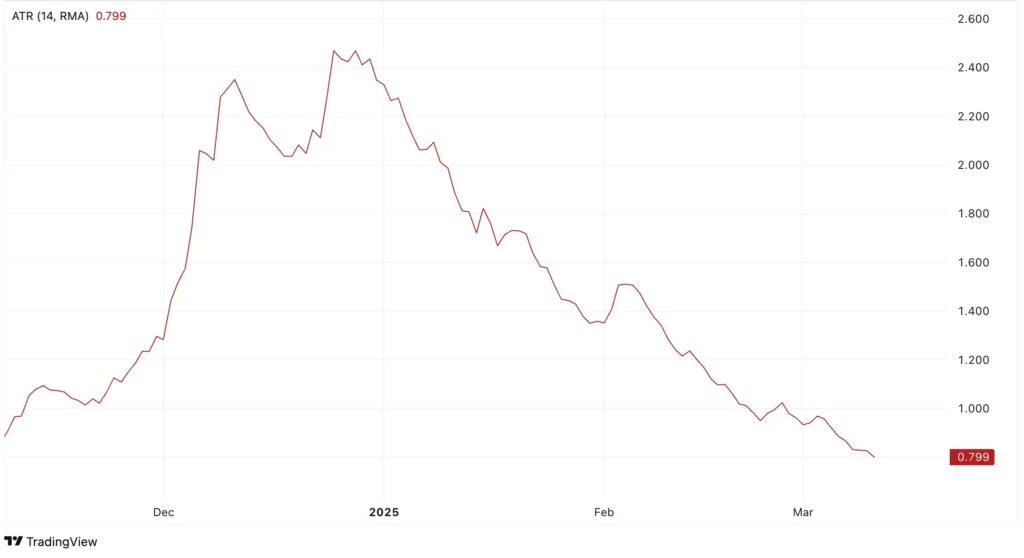
On March 11, 2025, Livepeer’s ATR was 0.799, suggesting relatively high volatility.
Livepeer Relative Strength Index (RSI): Is LPT Overbought or Oversold?
The Relative Strength Index (RSI) is a momentum indicator traders use to determine whether an asset is overbought or oversold.
Movements above 70 and below 30 show over and undervaluation, respectively. Movements above and below the 50 line also indicate if the trend is bullish or bearish.
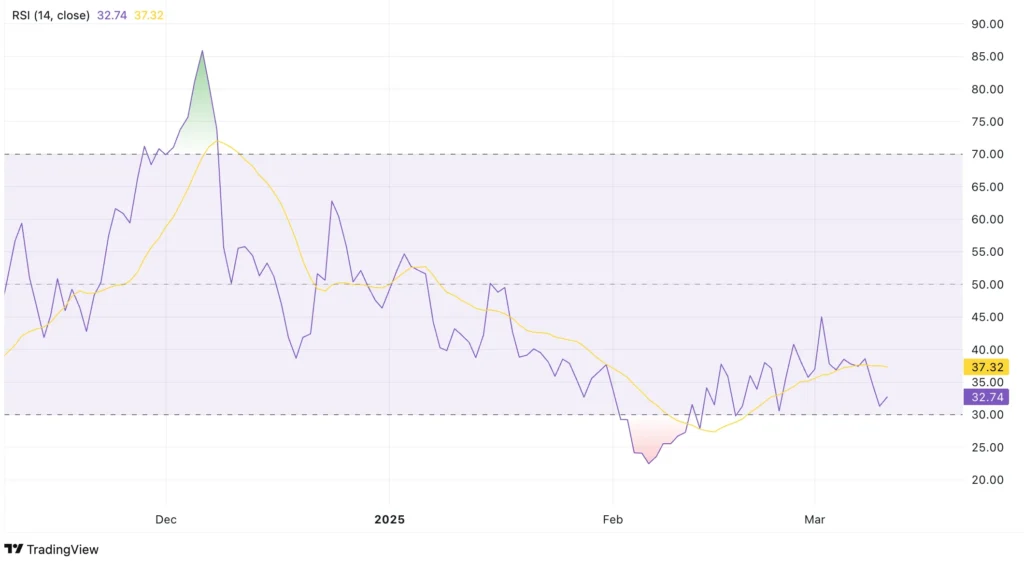
On March 11, 2025, the Livepeer RSI was at 32, indicating bearish conditions, verging on the oversold.
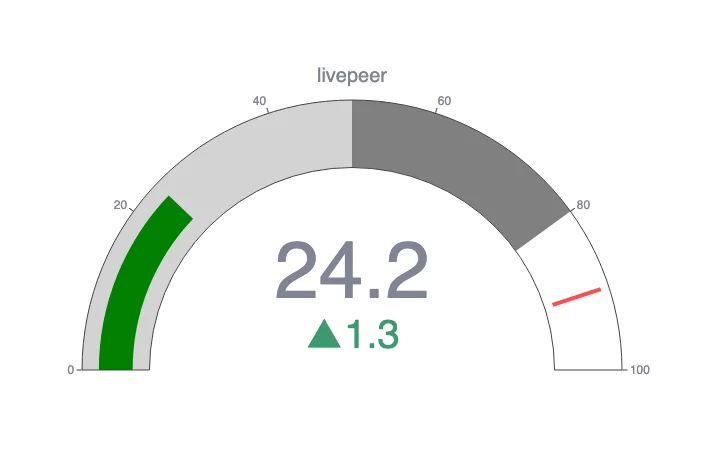
CCN Strength Index
The CCN Strength Index combines an array of advanced market signals to measure the strength of individual cryptocurrencies over the last 30 days.
Every day, it assigns a strength score, ranging from 0 to 100, to the top 500 assets by market capitalization on CoinMarketCap, focusing on both trend direction and the intensity of price movements.
0 to 24: Assets exhibit significant weakness, showing signs of sustained downtrend behavior.
25 to 35: The price tends to move within stable bounds with minimal volatility.
36 to 49: Assets begin a stable uptrend but without strong surges.
50 to 59: Consistent growth with moderate price advances, building momentum.
60+: Sharp price movements and high demand indicate stronger volatility and trend shifts.
The index dynamically adapts to rapid changes. For example, an asset experiencing a 100% increase within a short timeframe would see a sharp jump in its score to reflect the intensity of the rise.
However, should that asset stabilize at this new price level, the score will gradually taper down and align with the dampened momentum as the movement normalizes. The same principle applies to rapid declines: a sudden drop will spike the score downward, but as volatility decreases, the score will slowly adjust back up.
On March 11, 2025, Livepeer scored 24.2 on the CCN Index, suggesting very weak momentum.
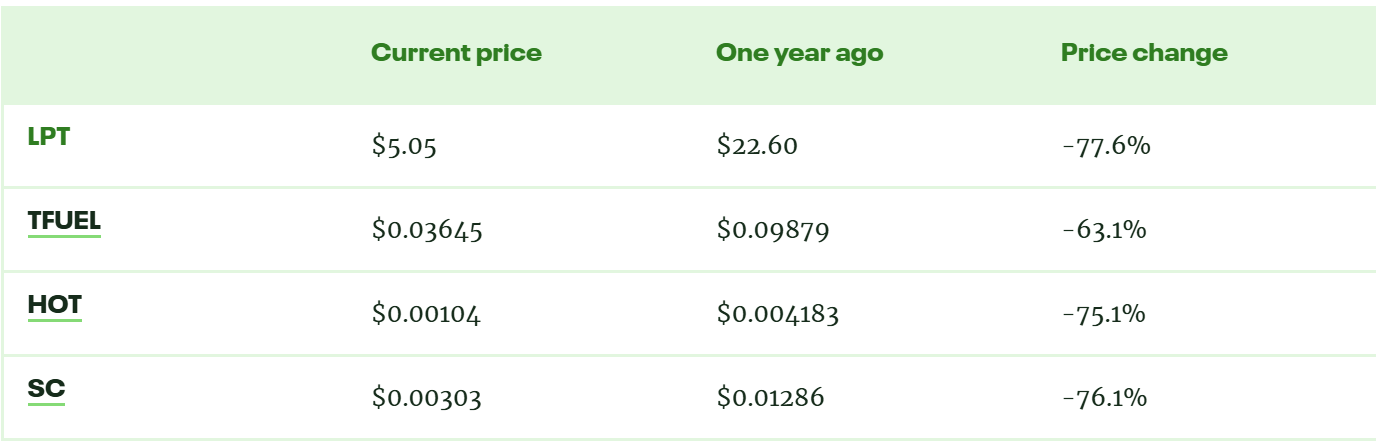
Livepeer Price Performance Comparisons
LPT is a DePIN token, so let’s compare it to some other cryptos from the same category with a similar market cap.
Best Days and Months to Buy Livepeer
We looked at the Livepeer price history and found the best times to buy LPT.

LPT Price History
Now, let’s examine the Livepeer price history. While we should never take past performance as an indicator of future results, knowing what the token has achieved can provide us with some very useful context if we want to make or interpret a LPT price prediction.