Bitcoin and Altcoin have seen a sharp sell-off following news that the United States Securities and Exchange Commission (SEC) filed a lawsuit against Binance for violating securities rules.
This lawsuit could delay the recovery of Bitcoin (BTC) and most major Altcoin , as traders may want to stay on the sidelines until some clarity emerges. Another upcoming event that could worry investors is the Federal Reserve meeting on June 14.
While the short-term picture is uncertain, Glassnode data shows that the largest pool of Bitcoin whales, possessing at least 10,000 Bitcoins, has accumulated over the past few days. On the other hand, all other major groups are in the distribution phase.
Where are the key support levels that could start a rally on Bitcoin and major Altcoin ? Study the charts to find out.
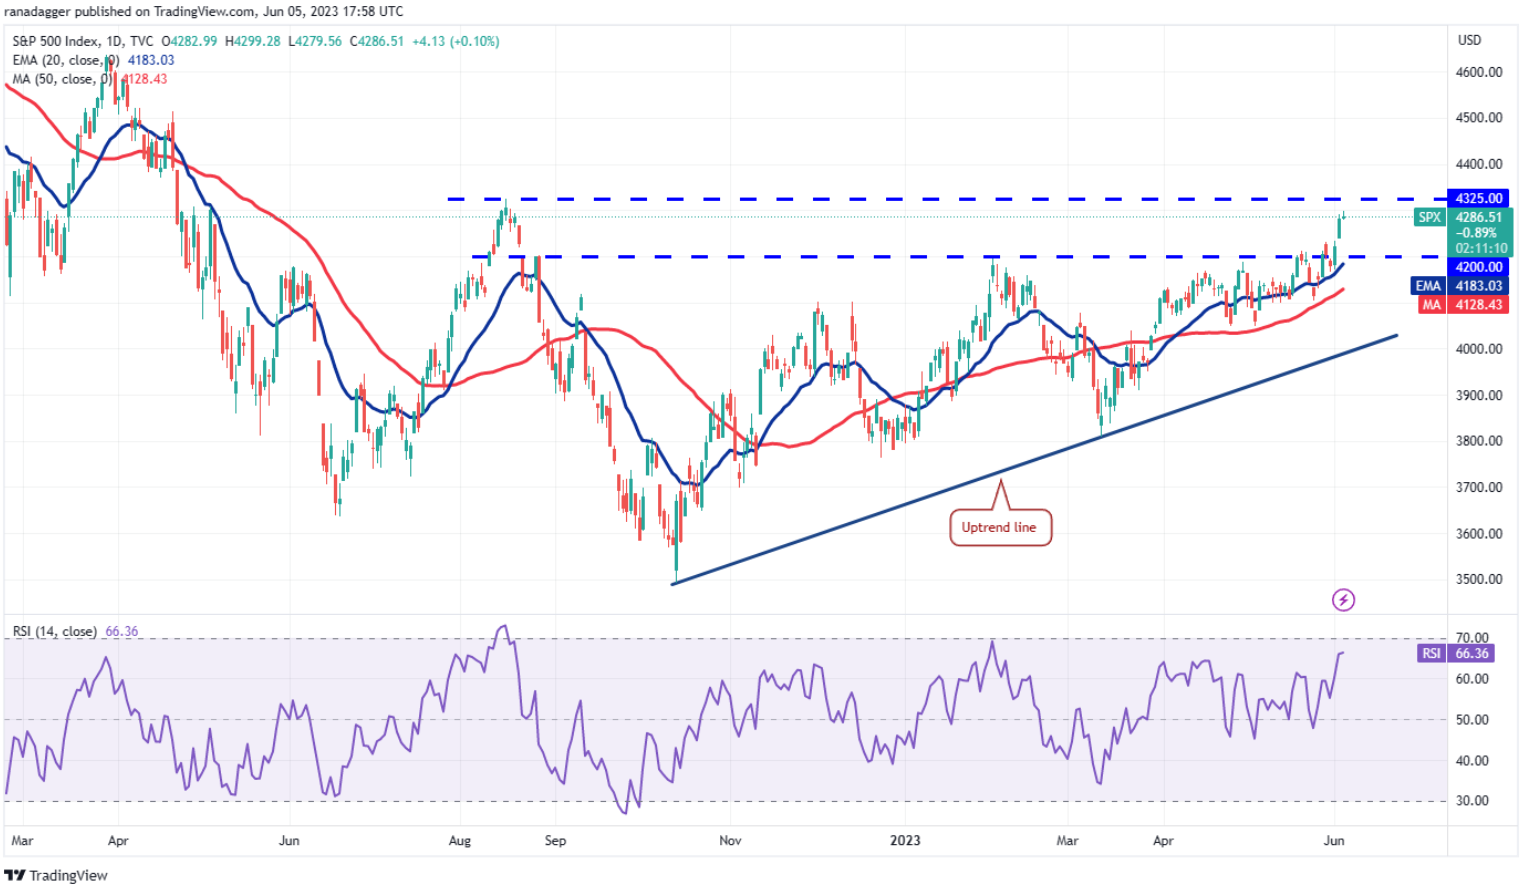
The S&P 500 Index (SPX) broke out and closed above the 4,200 resistance on May 26, completing an ascending triangle pattern.
SPX Daily Chart | Source: TradingView
The bears attempted to trap the aggressive bulls on May 30 and May 31, but the bulls actively bought in as the price dropped to the 20-day exponential moving average (EMA) at 4.183. The uptrend continued on June 1 and the bulls asserted authority on June 2.
There is a minor resistance at 4.325 where the bears will attempt to halt the upside momentum. On the way down, if the bulls fail to allow the price to slide below 4,200, it will raise the prospect of a move to the 4,500-4,600 zone.
Contrary to this assumption, if the price turns down and breaks below the 50-day simple moving average (SMA) at 4.128, it indicates that the recent breakout could be a bull trap. After that, the index might plunge to the uptrend line.
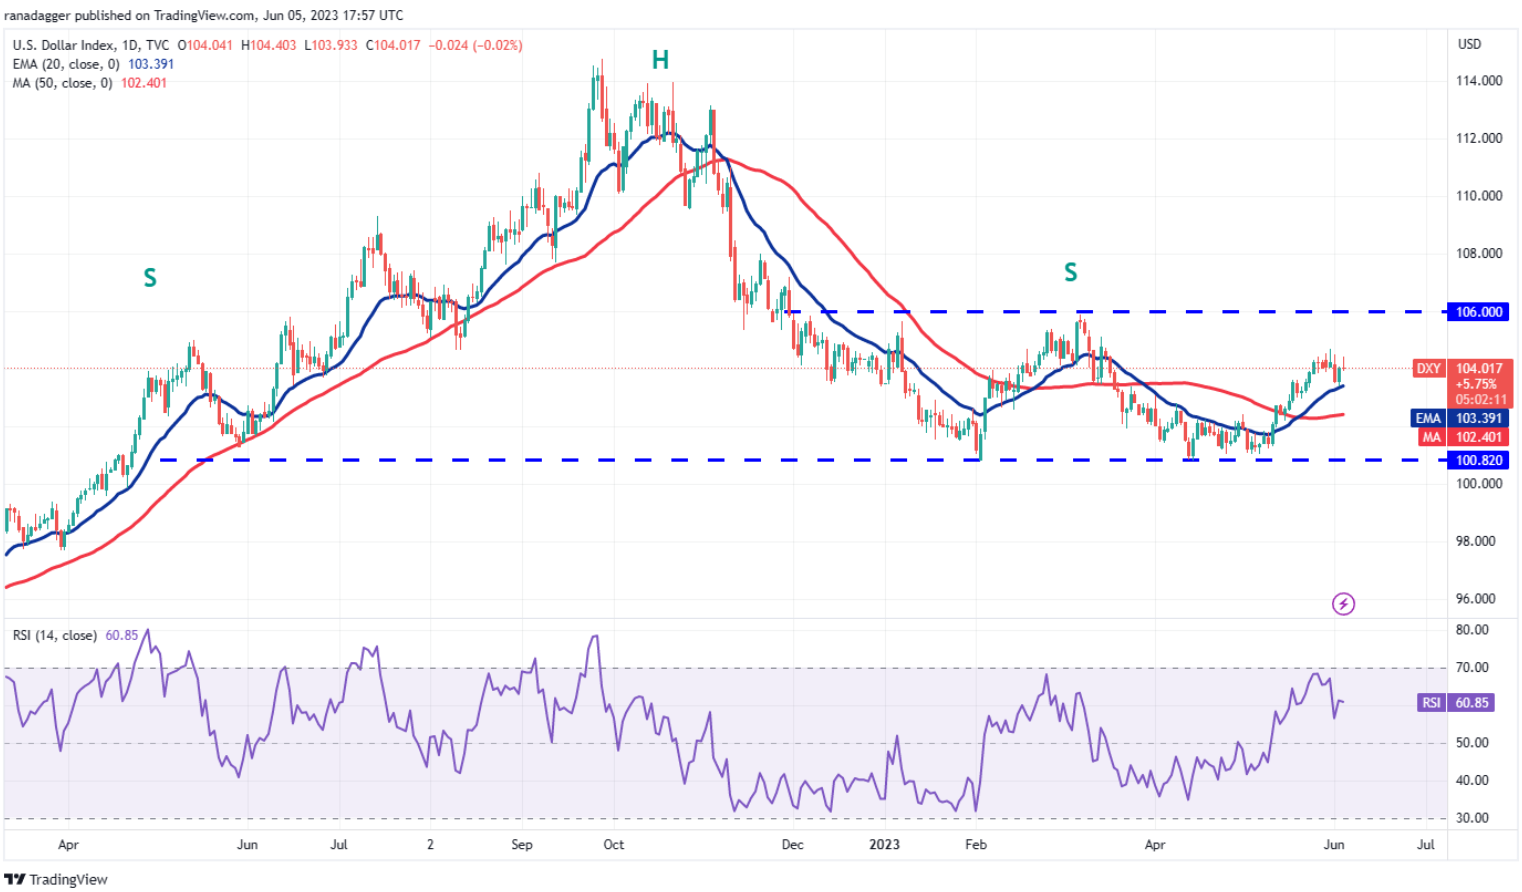
The US Dollar Index (DXY) bounced back from the 20-day EMA (103) on June 2, showing that sentiment has turned positive and the bulls are buying at the lows.
Daily DXY Chart | Source: TradingView
The bulls will attempt to push the price above the nearest resistance at 104.70. If they succeed, the index could reach as high as 106. This is an important level to watch as a break above it could start a new up move.
If the price turns down from 106 and breaks below the 20-day EMA, it shows that the index can extend its stay in the range for a few more days. The bears will have to drag the price below 100.82 to complete a bearish head and shoulders pattern.
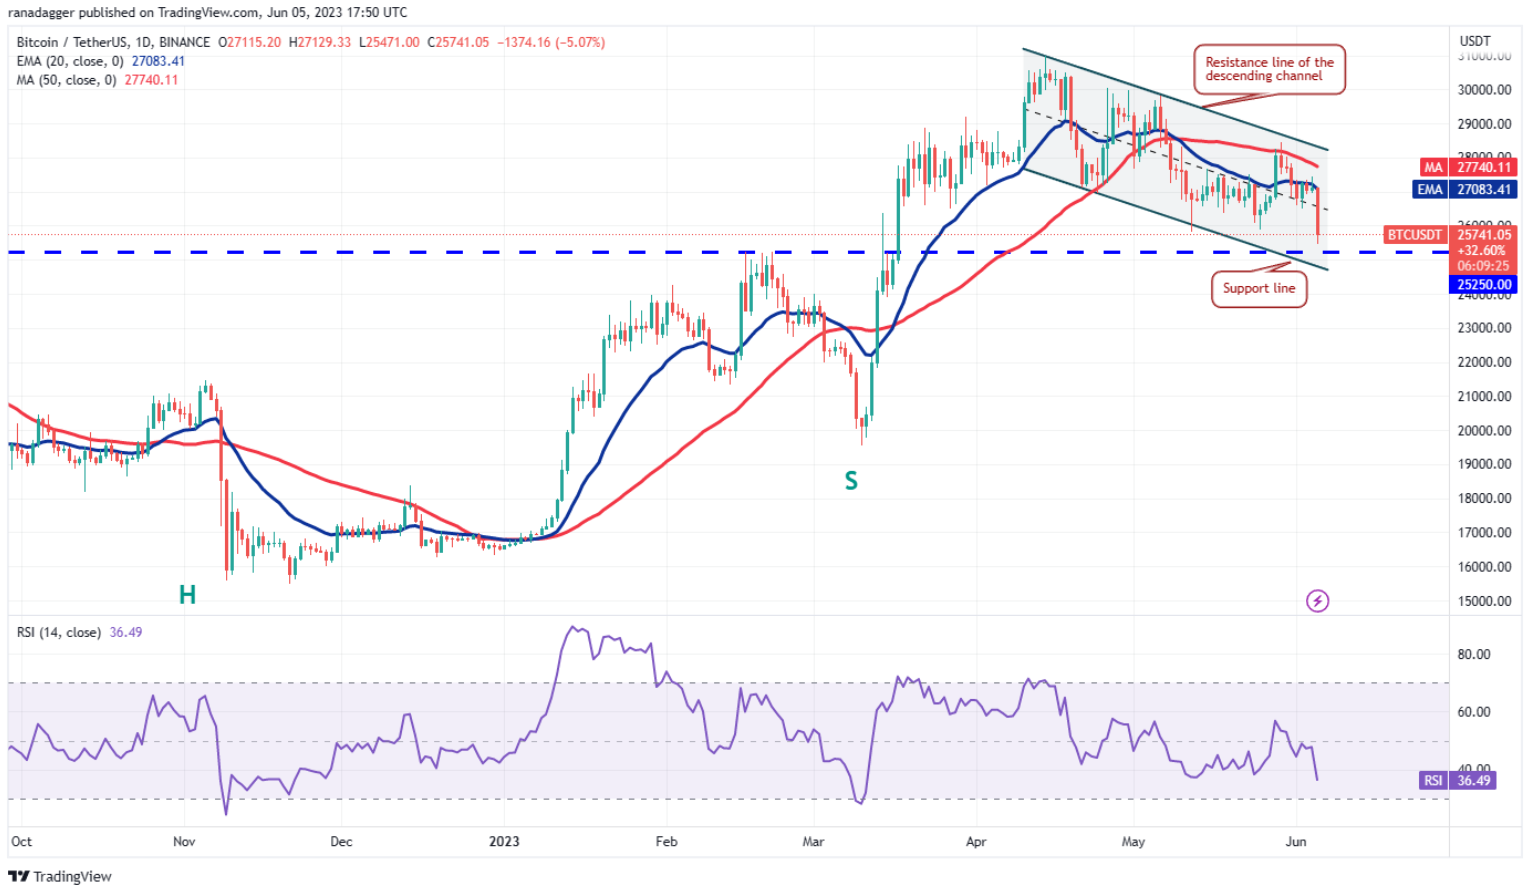
Bitcoin has been trading inside a descending channel pattern for the past few days. The bulls pushed Bitcoin above the 20-day EMA ($27.083) on June 4, but the long wick on the candlestick shows that the bears have sold on the rallies.
BTC/USDT Daily Chart | Source: TradingView
The price declined on June 5 and plummeted below the nearest support at $26,500. The selling momentum increased and the BTC/USDT pair dropped to the critical support area between $25,800 and $25,250.
Buyers are expected to aggressively defend this zone as a break below it could lead to the liquidation of long positions. After that, the pair can drop to $20,000.
The first strength will be a breakout and close above the descending channel. That could indicate the end of the correction period. After that, the pair can spike to $31,000.
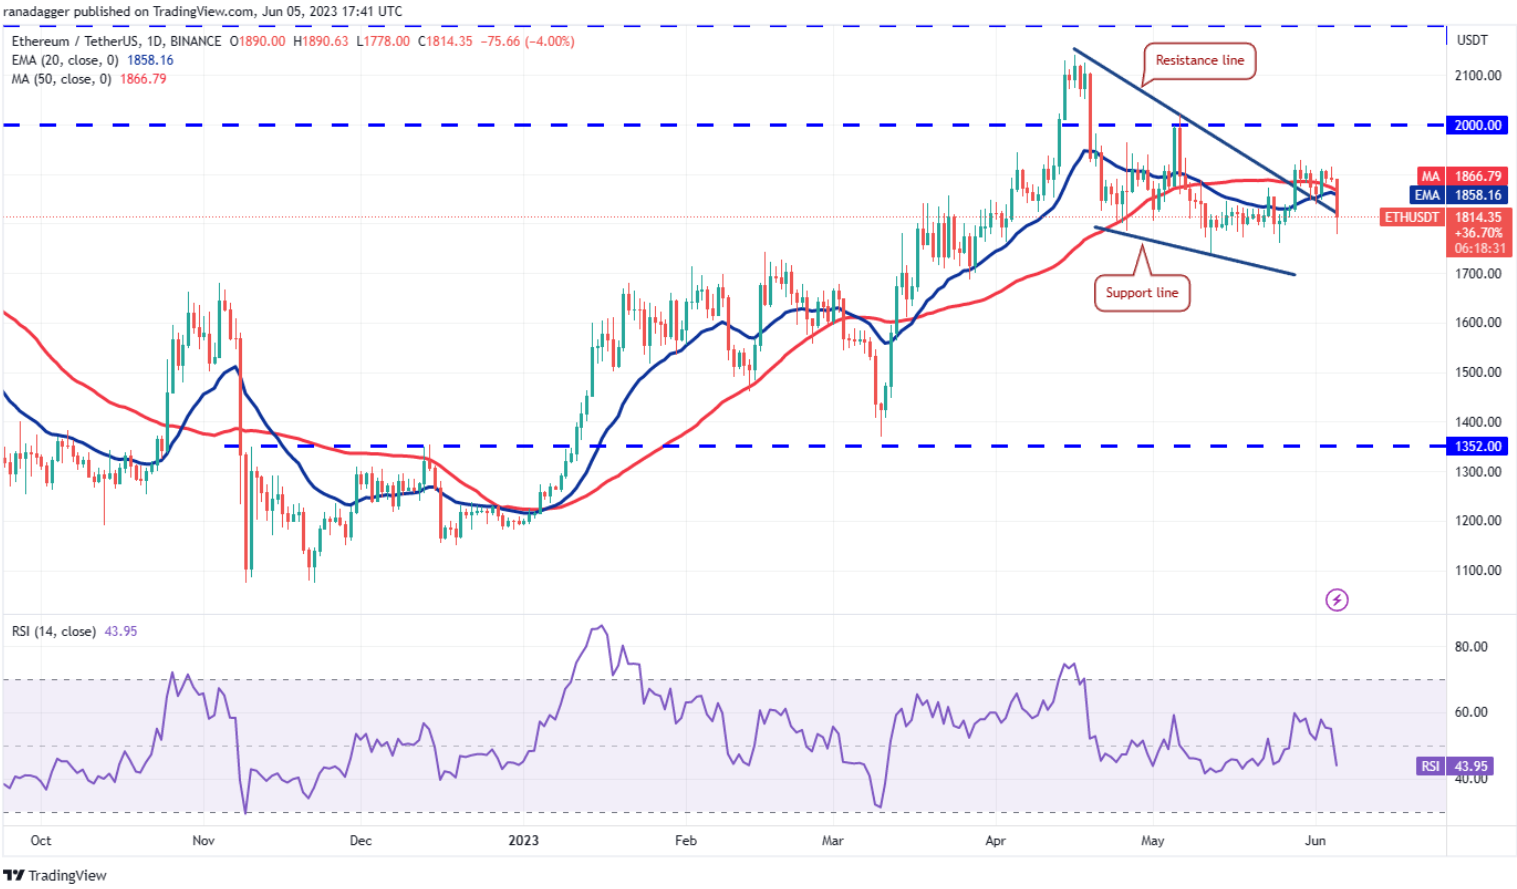
Ether (ETH) broke above a falling wedge on May 28 and confirmed it as support on June 1, but the bulls were unable to initiate a new upward move.
ETH/USDT Daily Chart | Source: TradingView
This has created an opportunity for the bears to turn around. Sellers dragged the price below the moving averages on June 5, which accelerated selling. The ETH/USDT pair has dropped to the resistance line of the wedge pattern. If this level fails to hold, the next stop could be at $1,740 and then the support line.
This negative view will be invalidated in the near term if the price rises and breaks above $1,928. The pair can then rally to $2,000 and finally to $2,200, where the bears can make a strong defense once again.
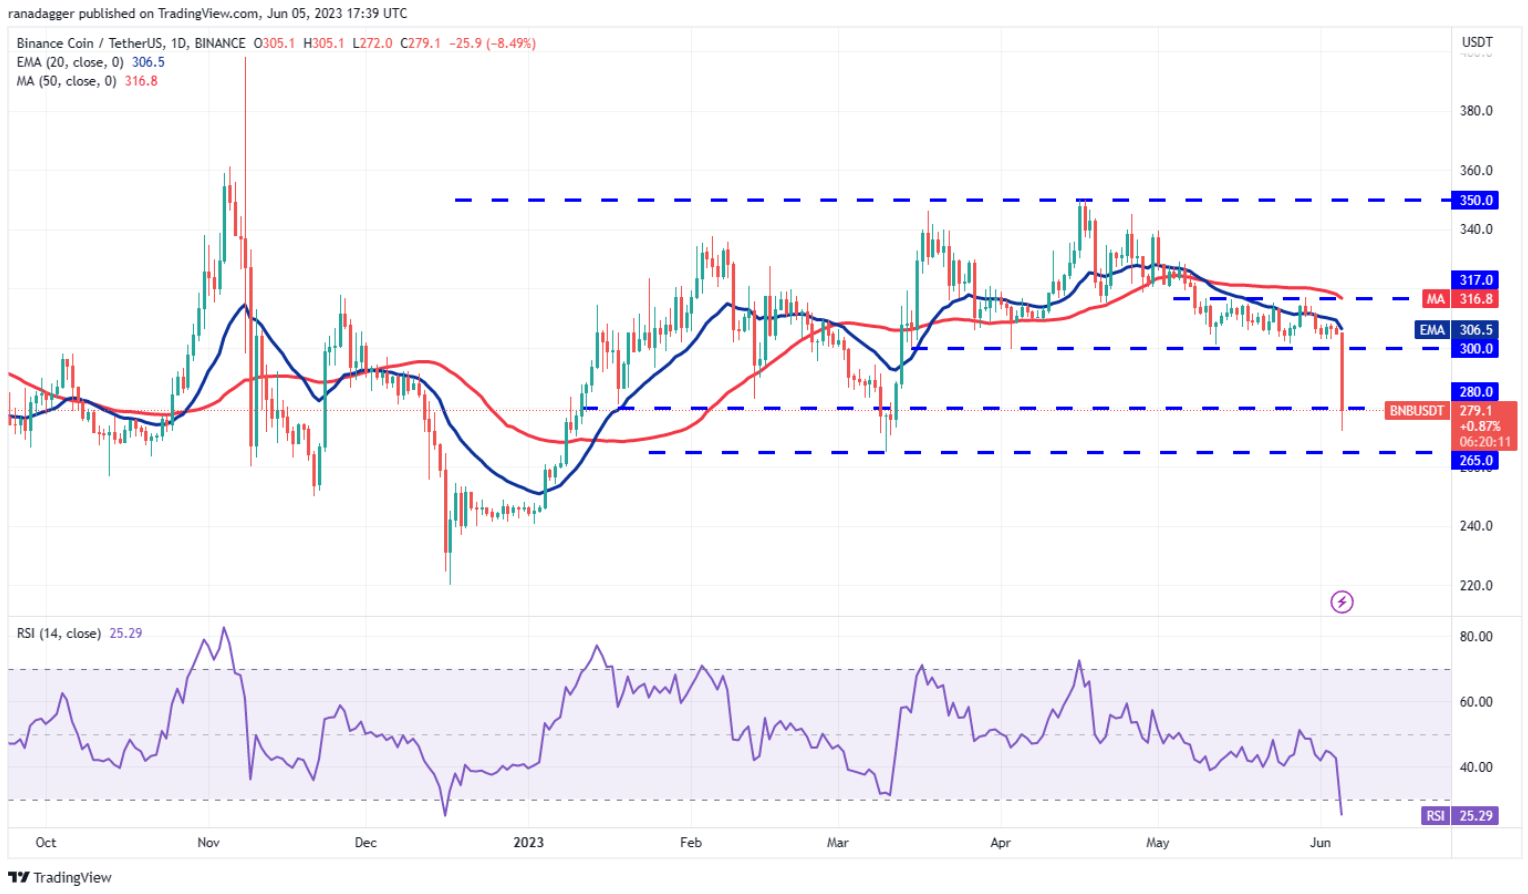
BNB 's (BNB) narrow range trading resolved to the downside on June 5. Strong selling pulled the price below $300 and the next support at $280.
BNB/USDT Daily Chart | Source: TradingView
The BNB/USDT pair can drop to $265, which is an important level to watch. If the price turns up from $265 and rises above $280, it shows strong buying at lower levels. The pair can then rally to the 20-day EMA ($306), where the bulls are likely to encounter strong selling by the bears.
On the downside, a break and close below the $265 support can start a new downtrend. The pair can drop to $240 and then to $220.
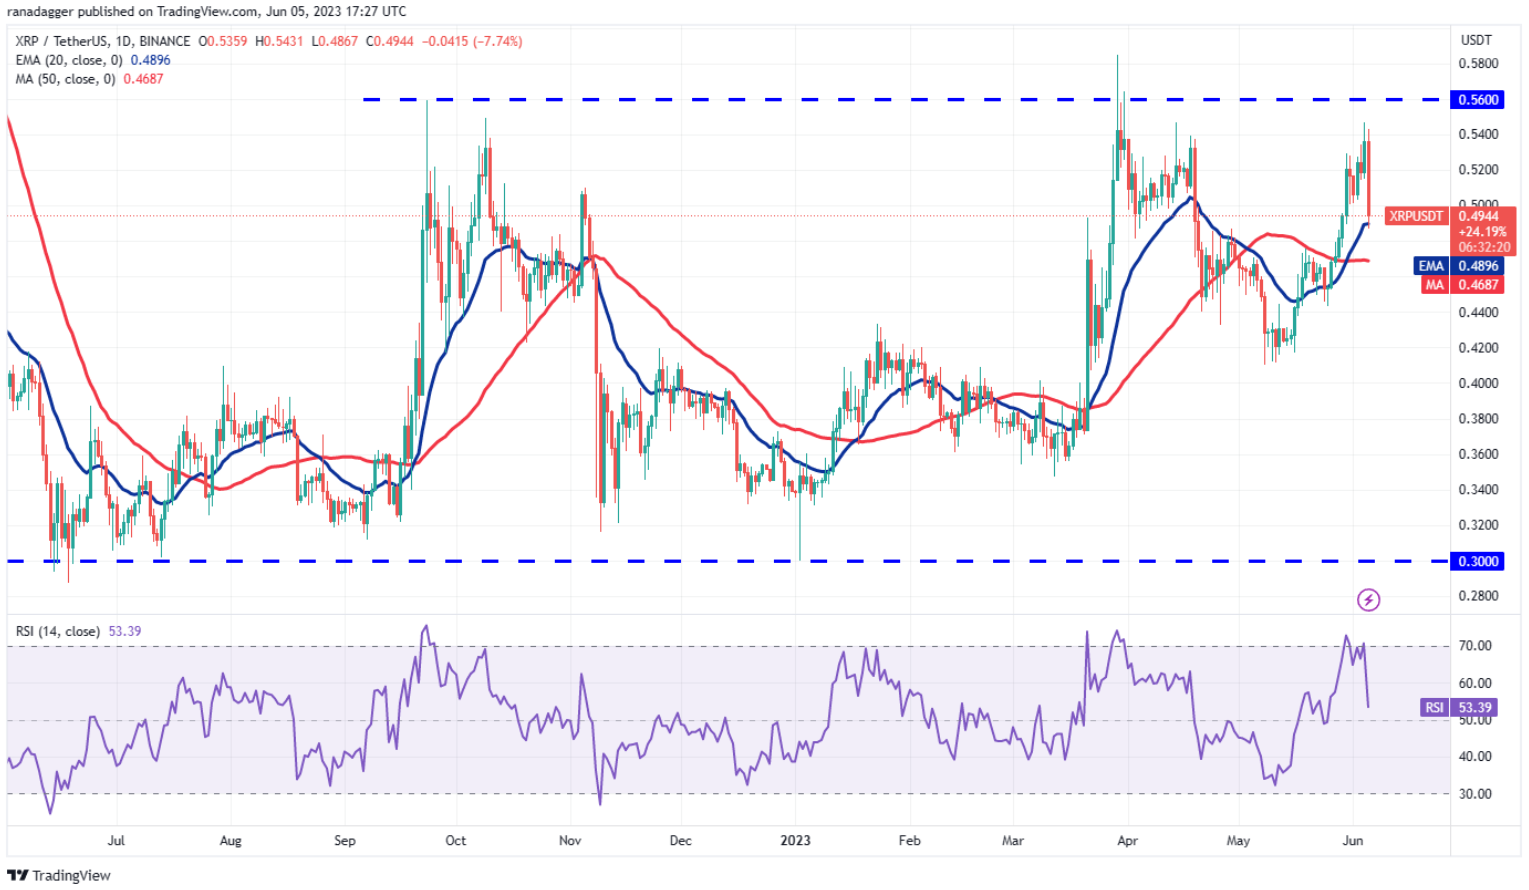
XRP (XRP) has been fluctuating in a large range between $0.56 and $0.30 for the past few months. In general, in such a well-defined range, traders typically buy at support and sell near resistance.
XRP/USDT Daily Chart | Source: TradingView
The XRP/USDT pair was rejected by overhead resistance on June 4, indicating profit-taking by the bulls and the opening of short positions by aggressive bears.
If the price turns up from the 20-day EMA ($0.49), it shows that sentiment has turned positive and traders are buying on a decline. The bulls will then make one more attempt to break through the overhead barrier.
Additionally, if the price drops below the moving averages, it suggests that the pair might remain range-bound for some time.
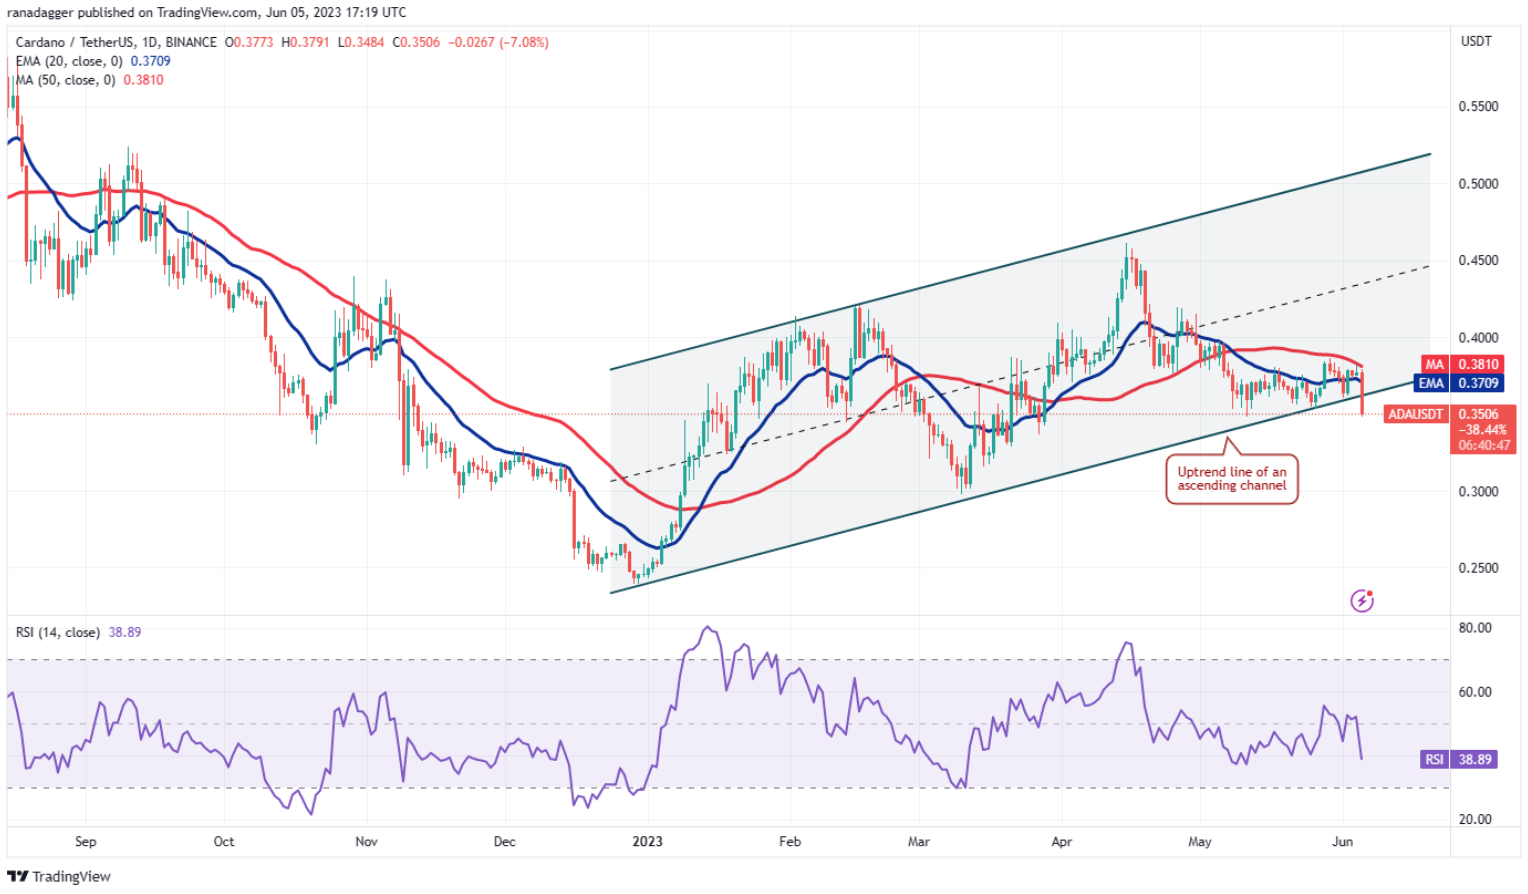
The long wick on the June 4 candle of Cardano (ADA) shows that the bears have successfully blocked a relief rally at the 50-day SMA ($0.38).
Daily ADA/USDT Chart | Source: TradingView
The ADA/USDT pair dropped on June 5 and plummeted below the ascending trendline of the ascending channel pattern. This move invalidated the bullish setup and the pair can drop to the critical support at $0.30.
If the bulls want to stop the downward move, they will have to quickly push the price back to the channel. Such a move would suggest that the pair rejected the lower levels. The upside momentum could pick up on a breakout above $0.39.
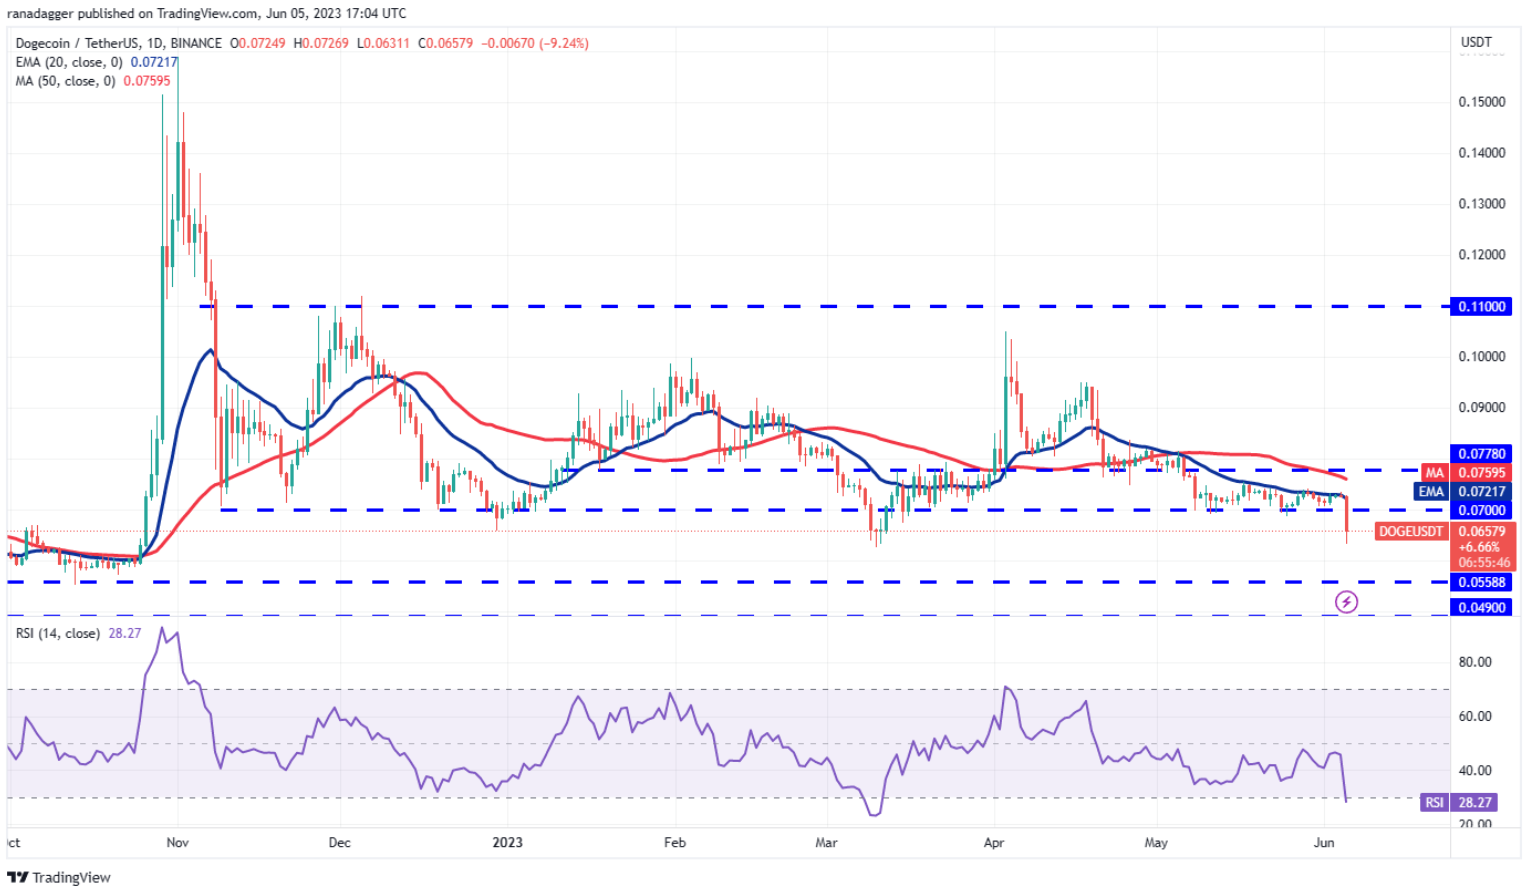
The bulls have repeatedly failed to push Dogecoin (Doge) above the 20-day EMA ($0.07) over the past few days, showing that the bears are fiercely defending this level.
Daily Doge/USDT Chart | Source: TradingView
Selling picked up momentum on June 5 and the bears dragged the price below the nearest support at $0.07. That may have hit a stop loss for some traders, opening the door for a further drop to $0.06. This level could attract strong buying by the bulls.
On the downside, $0.07 can now act as a stiff resistance on the rallies. The bulls will have to push and sustain the price above the breakdown of $0.07 to signal the start of a potential rally.
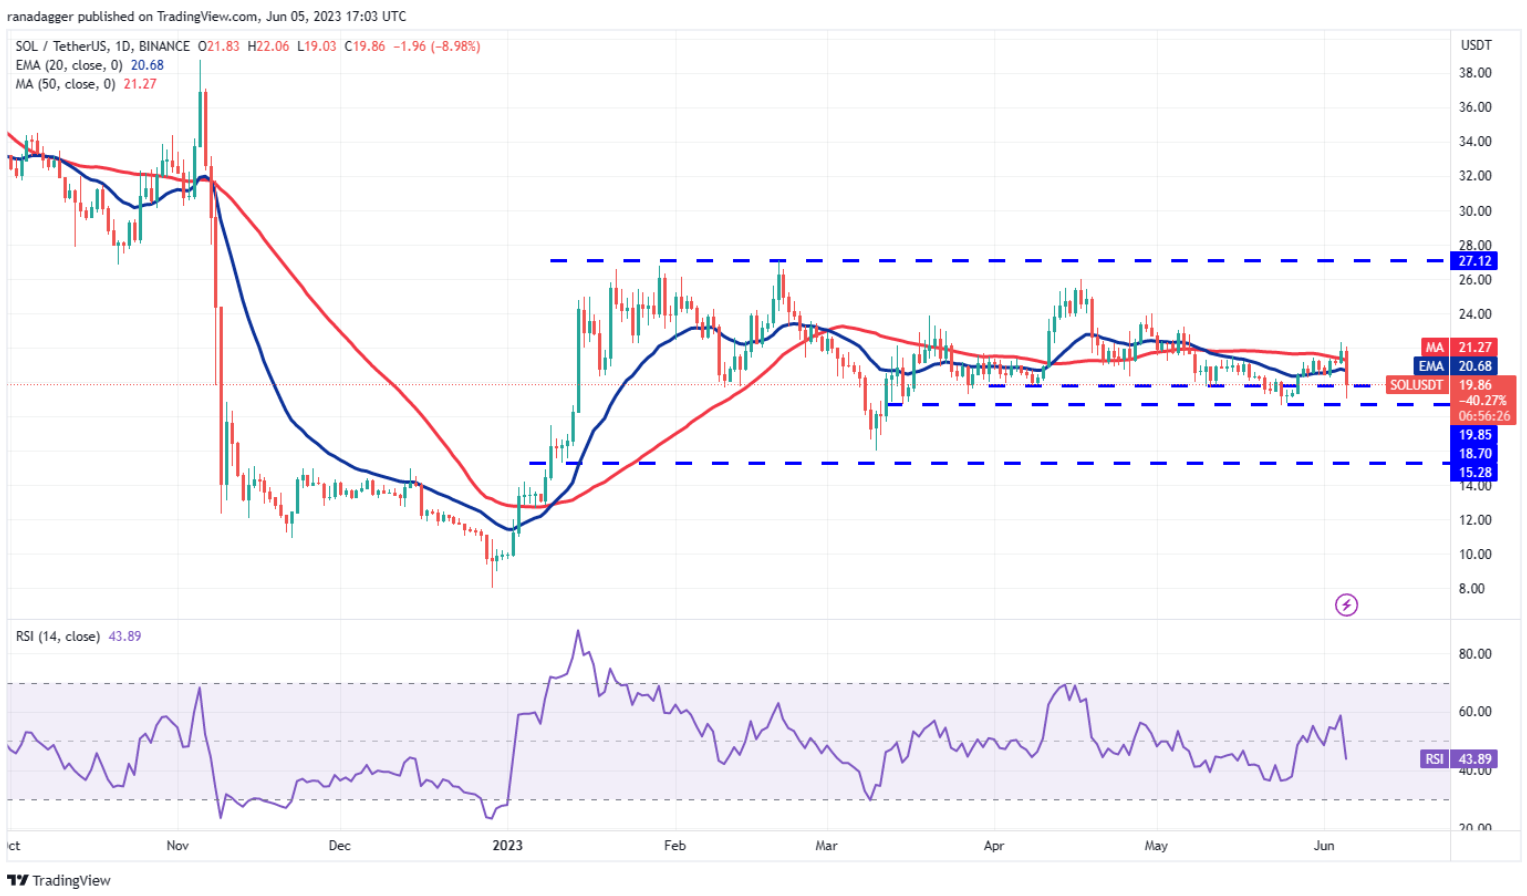
Solana (SOL) broke out above the 50-day SMA ($21.54) on June 4, but the bulls were unable to sustain the positive momentum. This indicates that demand dries up at a higher rate.
Daily SOL/USDT Chart | Source: TradingView
The bears sensed the opportunity and dragged the price below the moving averages. That may have trapped aggressive bulls, leading the price to drop to the strong support at $18.70. This is an important level to watch as a break and close below it opens the possibility of a drop to $15.28.
If the SOL/USDT pair bounces back from $18.70, the bulls will again attempt to break above the overhead barrier at the moving averages. A break and close above $22.30 can tilt the advantage in favor of the bears.
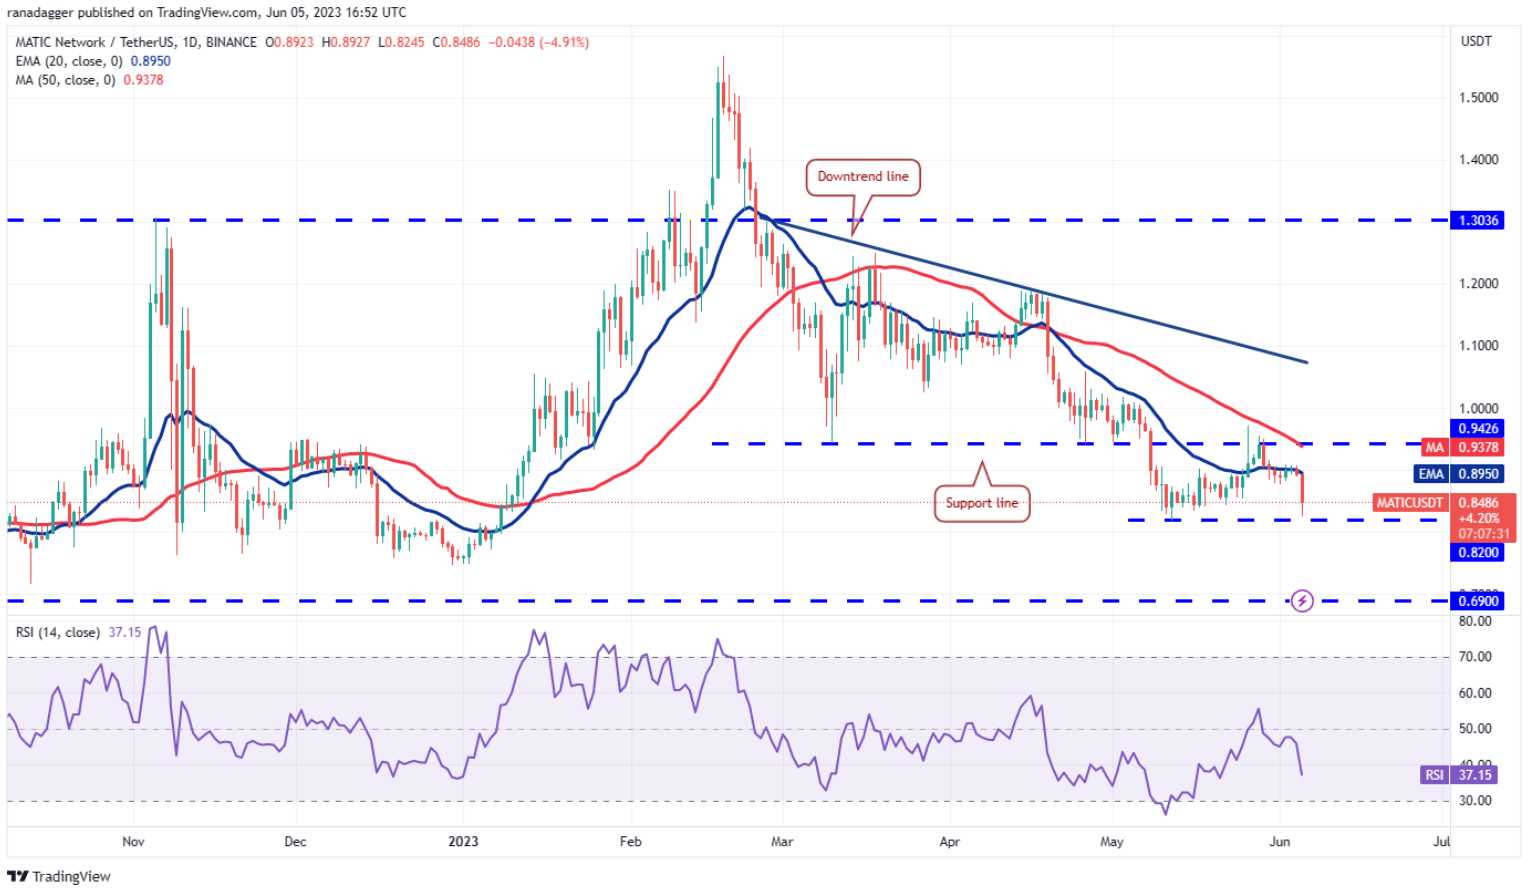
The bulls have been trying to push Polygon (Matic) above the 20-day EMA ($0.89) for the past few days, but the bears hold their ground.
Matic/USDT Daily Chart | Source: TradingView
Selling increased sharply on June 5 and the bears pulled the price towards the critical support at $0.82. Buyers are expected to defend this level aggressively. A strong bounce from this support would suggest that the pair might remain stuck between $0.82 and $0.94 for some time.
Conversely, if the support at $0.82 breaks, the Matic/USDT pair can start to decline to the next major support at $0.69. The bulls will have to push and sustain the price above the moving averages to signal the start of a sustained rally.
You can XEM the coin prices here .