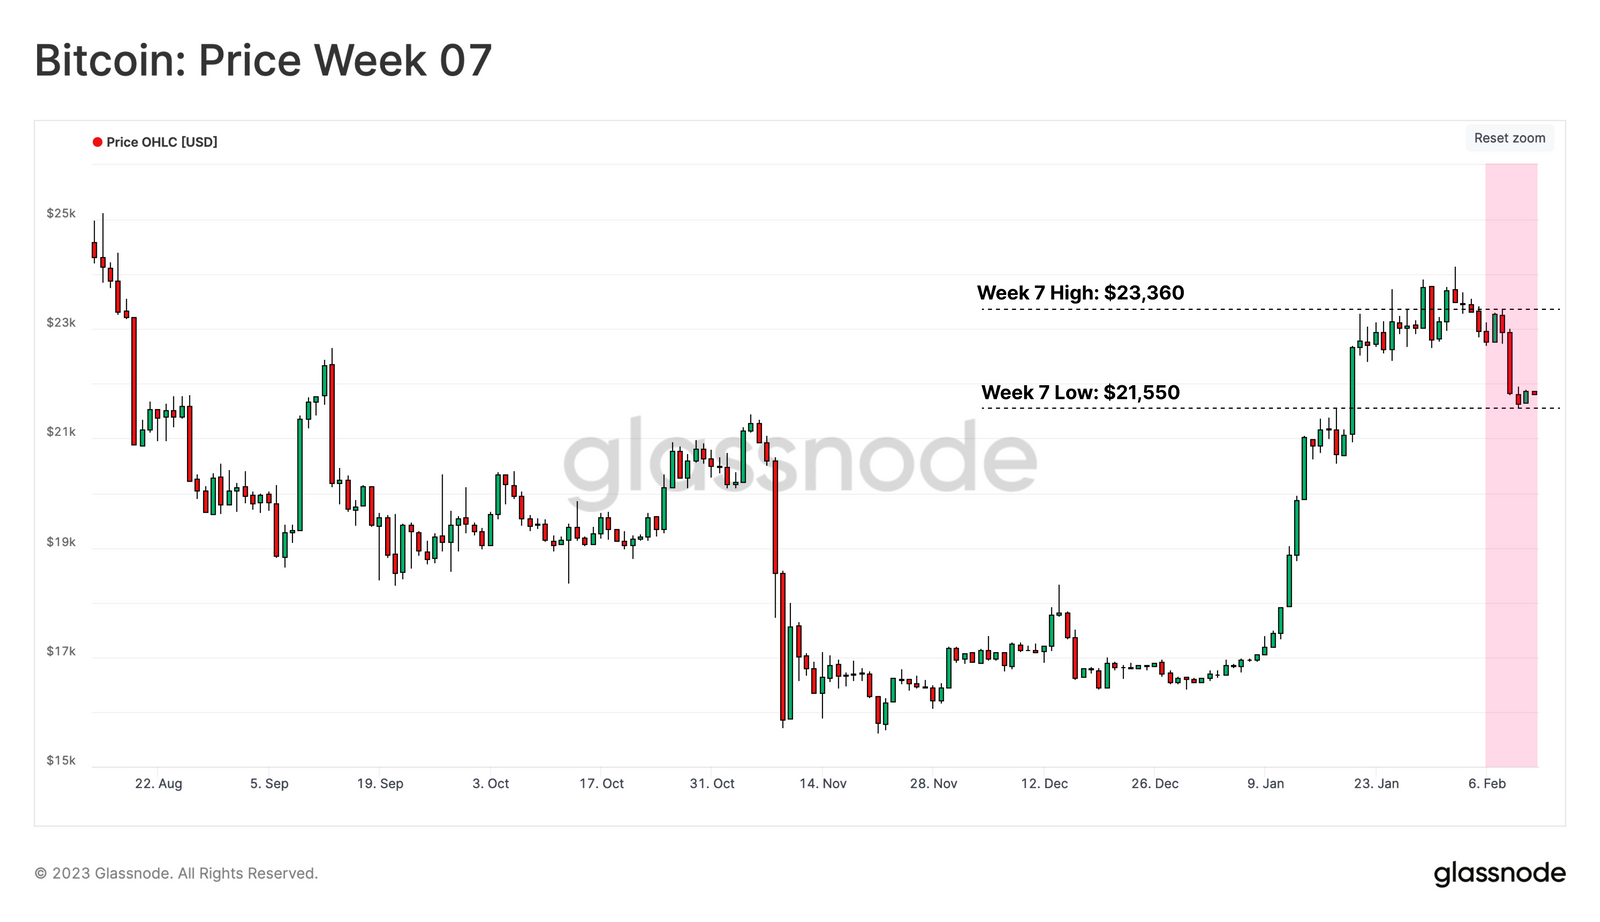
The digital asset market has experienced the first significant pullback since the rally throughout January, retracing from a weekly high of $23.3k to a low of $21.5k. This comes alongside significant regulatory news coming out of the US, such as the SEC issuing a fine to Kraken for their staking services, legal action by the SEC against Paxos for issuing the BUSD stablecoin, as well as several actions against crypto banking partners and payment providers.
Recent weeks have also seen the somewhat surprising introduction of NFTs hosted on the Bitcoin blockchain in the form of Ordinals and Inscriptions, with over 69k Inscriptions already created. As a result, there has been a significant uplift in Bitcoin network activity, and rising fee pressure.
In this week's edition, we will explore the Bitcoin network from two key angles:
1.The behavior of investors during the pullback from the local high signalled by a point of high unrealized profit for new buyers.
2.The emergence of Ordinals and the unique impact it has had on on-chain activity and fee market pressure.
A Decisive Range
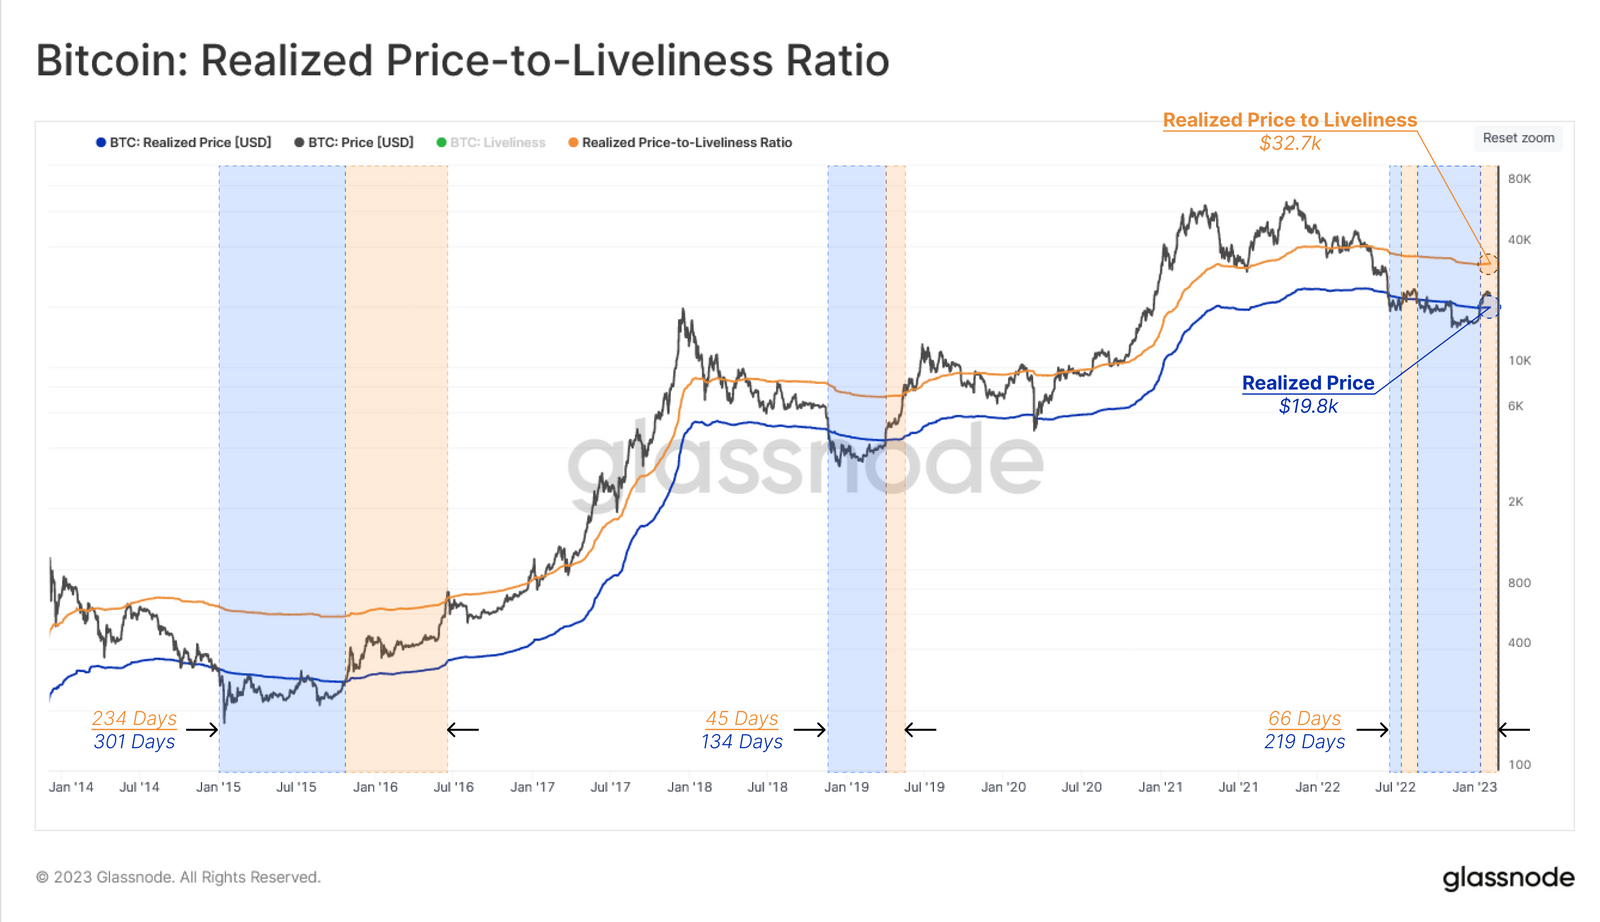
With the spot price of Bitcoin breaking above the Realized Price, the market has entered what has historically been a macro transitional phase, generally bounded by two pricing models:
The lower band of this zone is the Realized Price 🔵 ($19.8k), corresponding to the average on-chain acquisition price for the market.
The upper band is determined by the Realized Price to Liveliness ratio 🟠 ($32.7k), a variant of the Realized Price reflecting an ‘implied fair value’ weighted by the degree of HODLing activity.
Comparing previous periods within the aforementioned range, we note a similarity between the present market, and 2015-16 and 2019 re-accumulation periods.
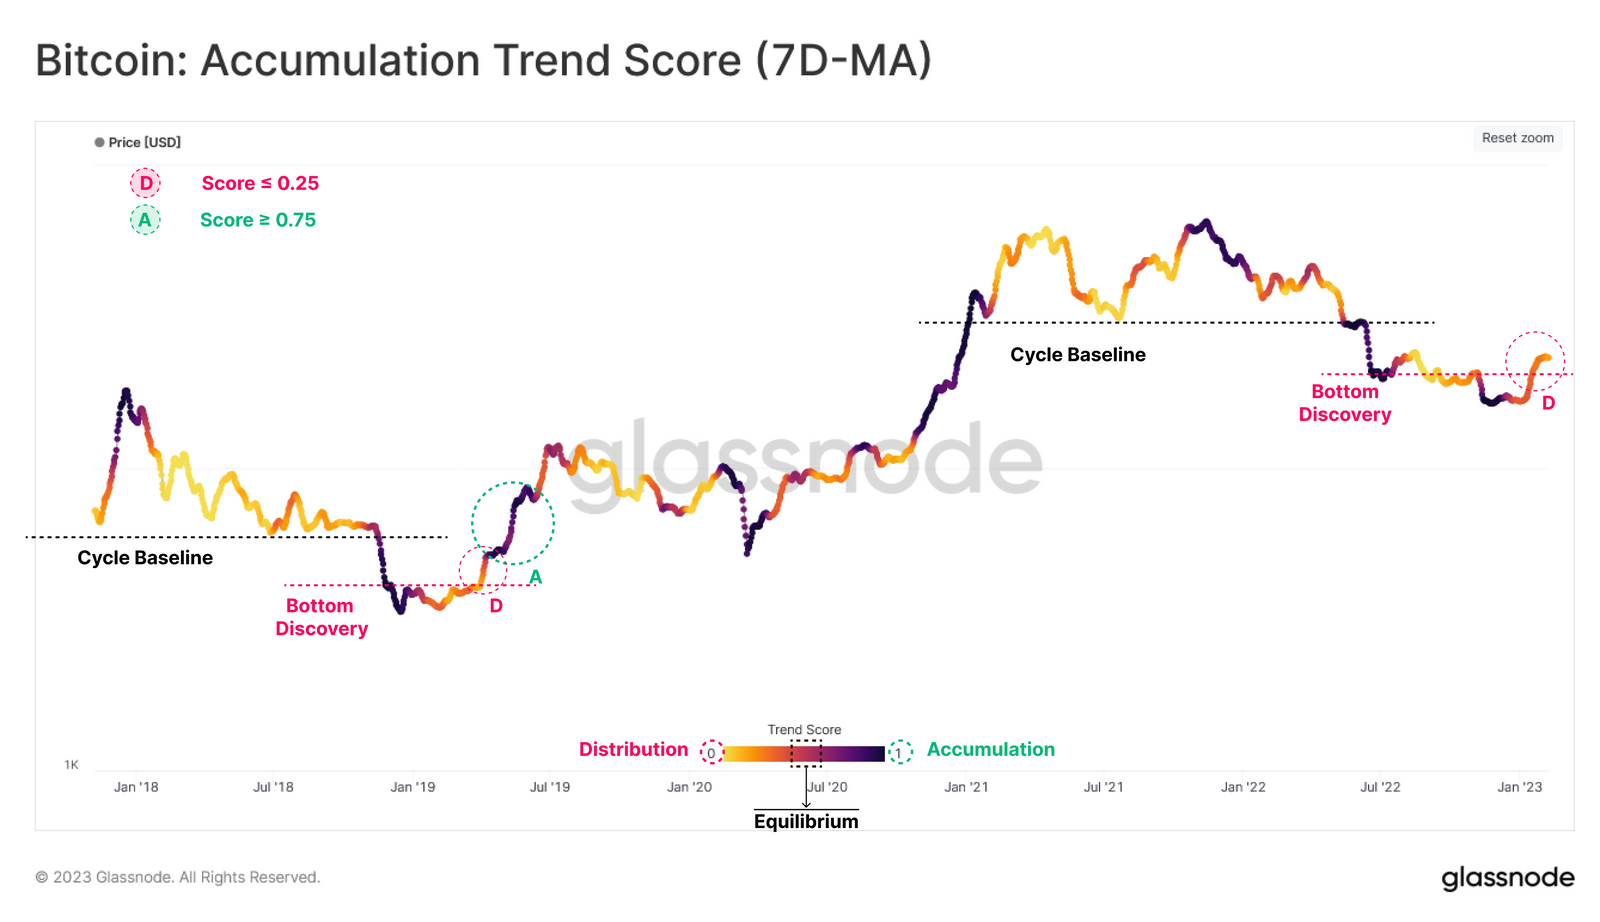
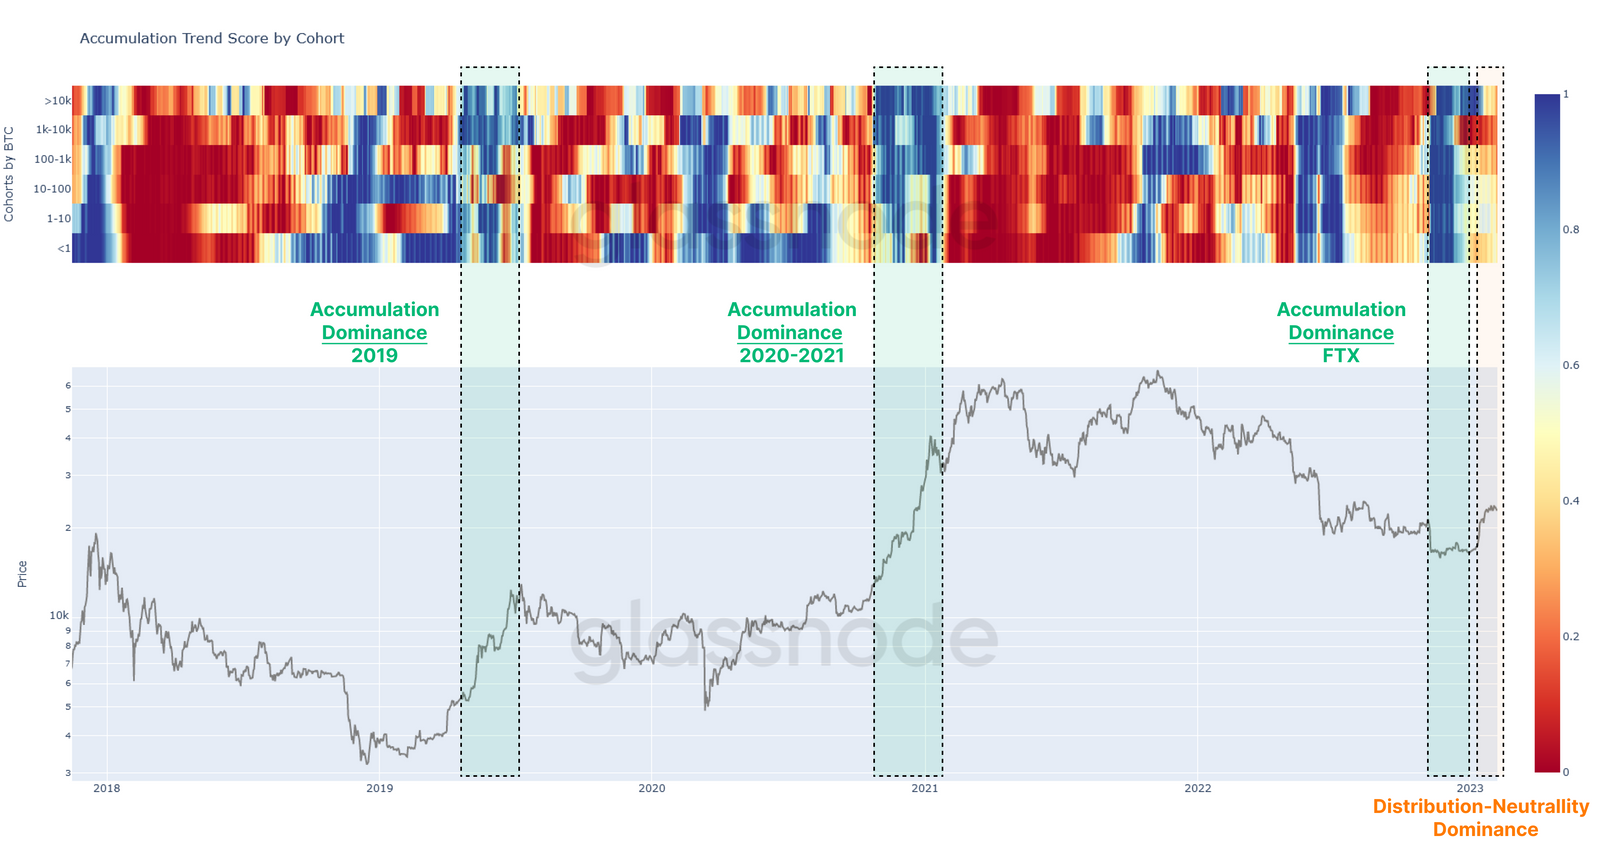
The price rally has paused at a local high of $23.6k. We can inspect investor behaviour at this time by leveraging the Accumulation Trend Score, reflecting the aggregated balance change of active investors over the past 30 days. A higher weight is assigned to larger entities (such as whales and institutional sized wallets), and a value of 1 (purple colors) indicates that a wide cross-section of investors are adding meaningful volumes of Bitcoin to their on-chain balance.
Comparing to previous bear markets, similar rallies out of the bottom discovery phase have historically triggered a degree of distribution, primarily by the entities that accumulated near the lows. The recent rally is no exception (🔴 D), where this metric has dropped below 0.25.
Accordingly, the sustainability of the prevailing rally will have some dependence on whether these larger entities continue to accumulate (🟢 A), resulting in the Accumulation Trend Score advancing back towards a value of 1.0.
We can further inspect the components of the Accumulation Trend Score, to provide granular analysis of various wallet balance cohorts. We observe a shift in the aggregated behavior of investors across all cohorts, from net Accumulation (post FTX capitulation) 🟩 to Distribution-Neutral ** 🟧 during recent weeks.
Among all cohorts, the entities owning 1k-10K BTC have recorded the sharpest change in behaviour, moving from net accumulation, to marked distribution 🟥.
In Between Cost Basis
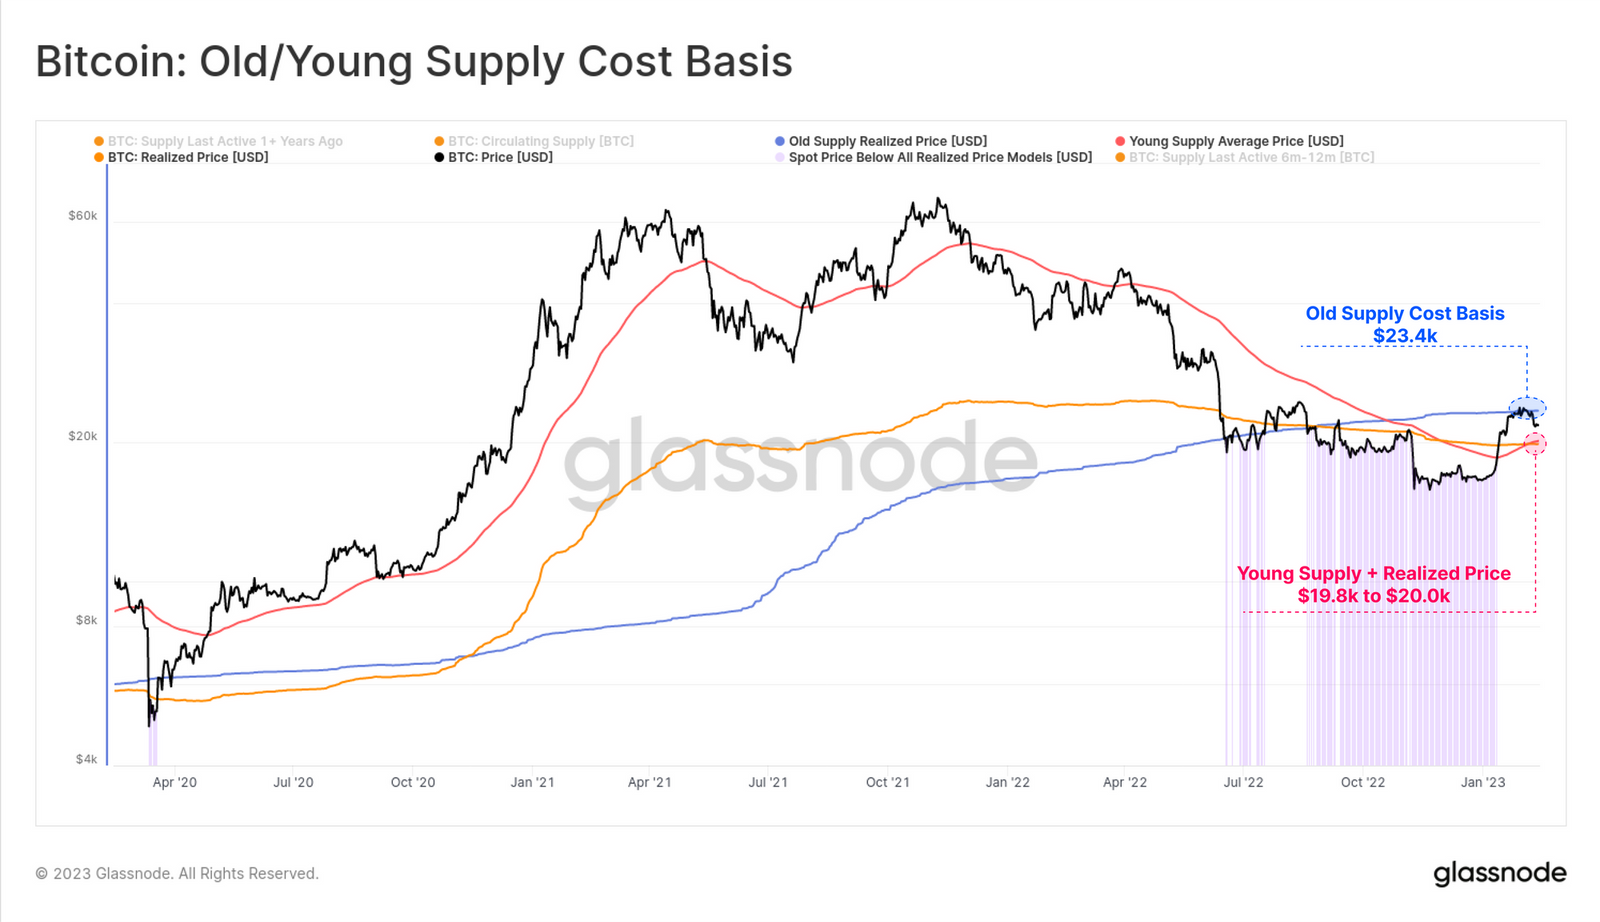
In general, after the Bitcoin market retraces from an extreme level (such as macro tops or bottoms), the behavior of the most recently active investors tends to become a dominant factor. The chart below shows that price stalled near the cost basis of Old Supply $23.4k (> 6-months 🔵), and has both the Realized Price (🟠) and Young Supply (< 6-months 🔴) sitting below at $19.8k to $20.0k.
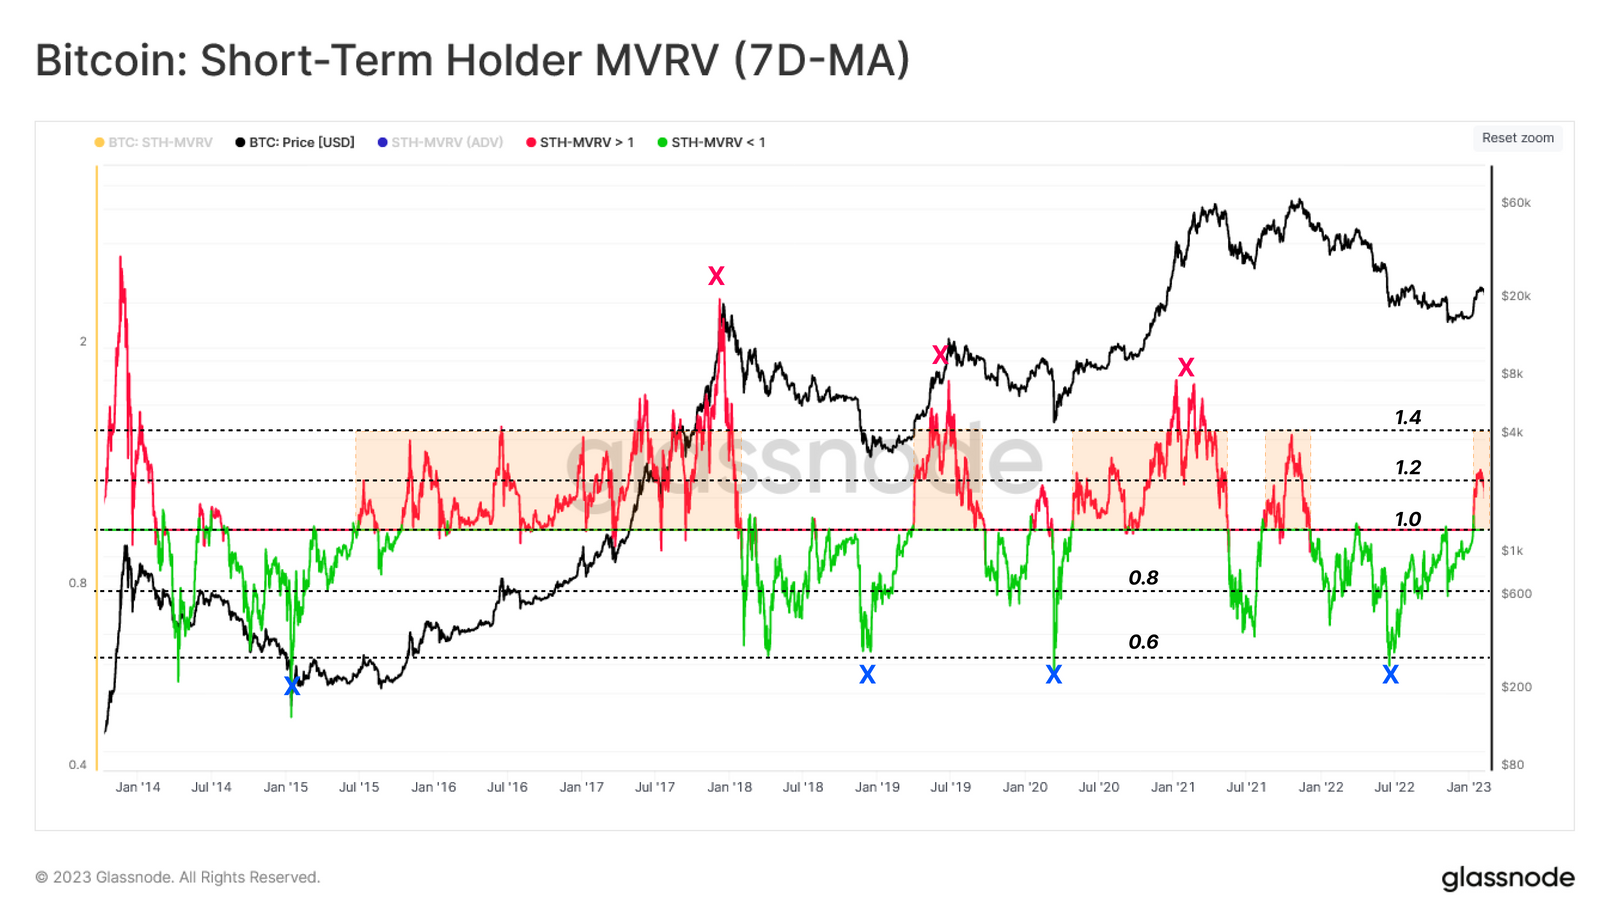
Zooming into recent buyers, we can estimate their average unrealized profit multiple held by using the Short-Term Holder MVRV. This metric measures the ratio of spot price to their on-chain cost-basis. Using the weekly average of this indicator, we can identify the following observations:
- Breaks above 1 puts new investors into an unrealized profit, which tends to signal a market transition is underway.
- Macro tops (and bottoms) continue to be remarkably similar, with the average unrealized profit multiple of +40% profit signalling tops, and -40% loss signalling bottoms.
- Local tops (and bottoms) are often signalled by the STH-MVRV returning to a central value of 1.0 as investors react to prices returning to their break-even levels.
- The possibility of short-term corrections tend to increase during periods where short-term holders are +20% in money (STH-MVRV = 1.2) or -20% out of money (STH-MVRV = 0.8).
The recent rejection at the $23.6k level resonates with this structure, as the STH-MVRV hit a value of 1.2. Considering the third observation, and in case of further correction, the market returning to $19.8K would indicate a STH-MVRV value of 1.0, and align with a return to the cost basis of the cohort of new buyers, and the Realized Price.
🔔 Alert Idea: STH-MVRV (7D-SMA) reaching a value of 1.0 would signal price has returned to the average Short-Term Holder cost basis and break even level.
Positive On-chain Momentum
With the recent emergence of Ordinals and Inscriptions on Bitcoin, there has also been a notable uptick in on-chain activity metrics, mostly related to activity, despite a relatively small impact on total supply moved.
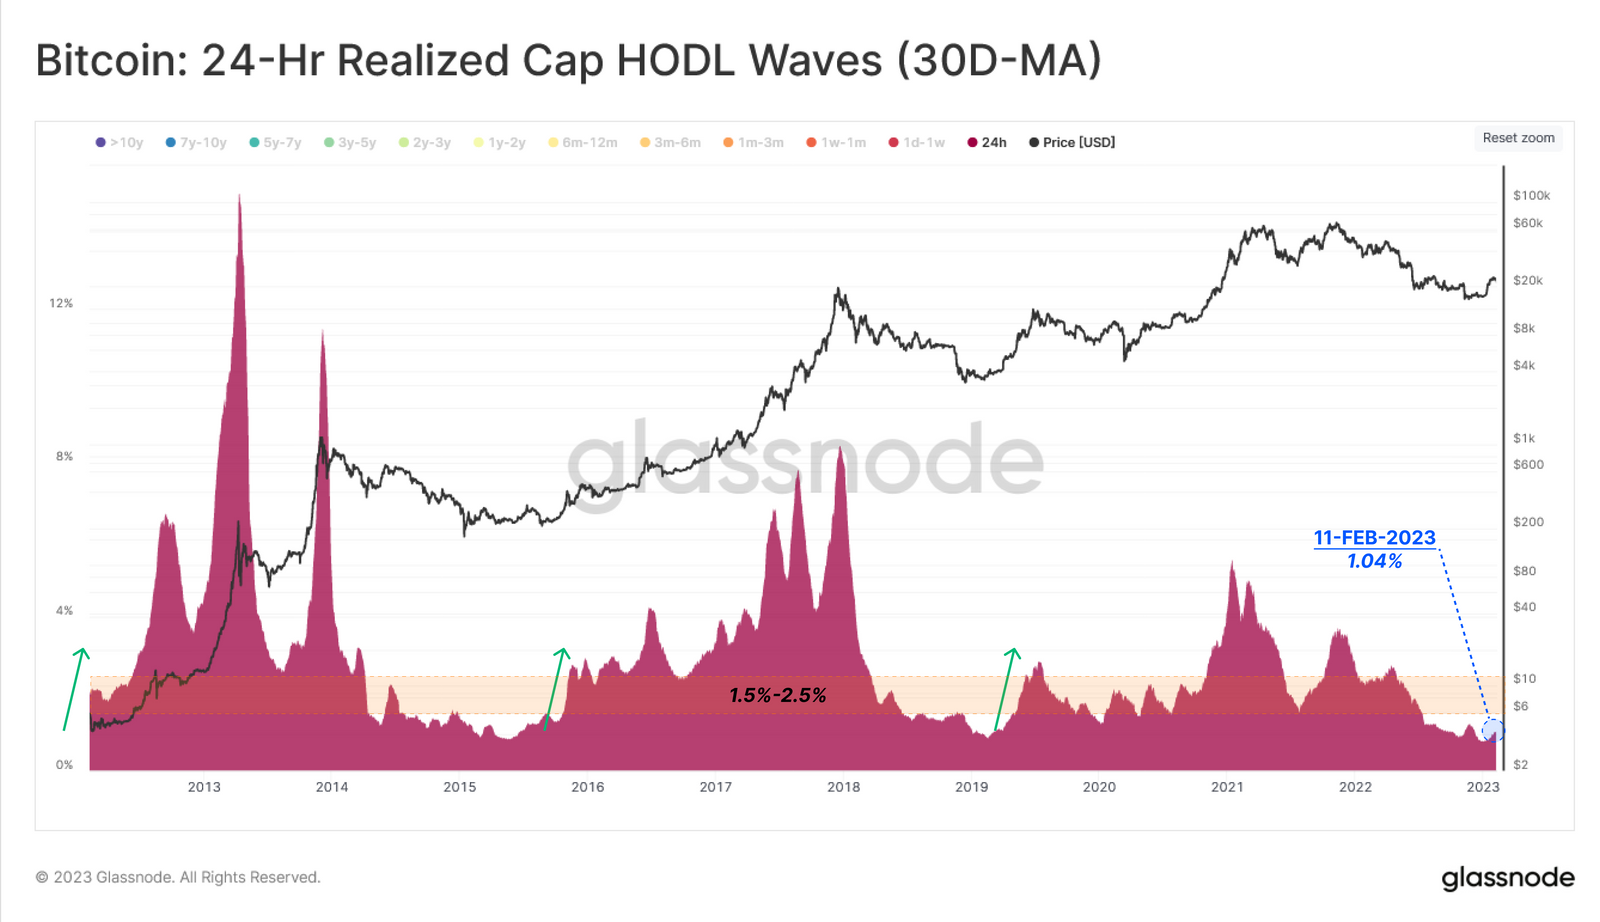
The magnitude of wealth moving on a daily basis can be tracked via the 1-day band of Realized Cap HOLD Waves. This metric captures the relative share of USD wealth changing hand on a daily basis.
We can identify periods of elevated demand, and large volumes of wealth changing hands when we observe a substantial increase above the 1.5% to 2.5% level. This latest rally has seen only a modest uptick in this metric, rising from 0.75% to 1.0%.
This indicates that whilst network activity is climbing, it is not yet correlated with a large ‘revaluing’ of coins that were acquired at higher or lower prices (i.e. low degree of coin volume changing hands).
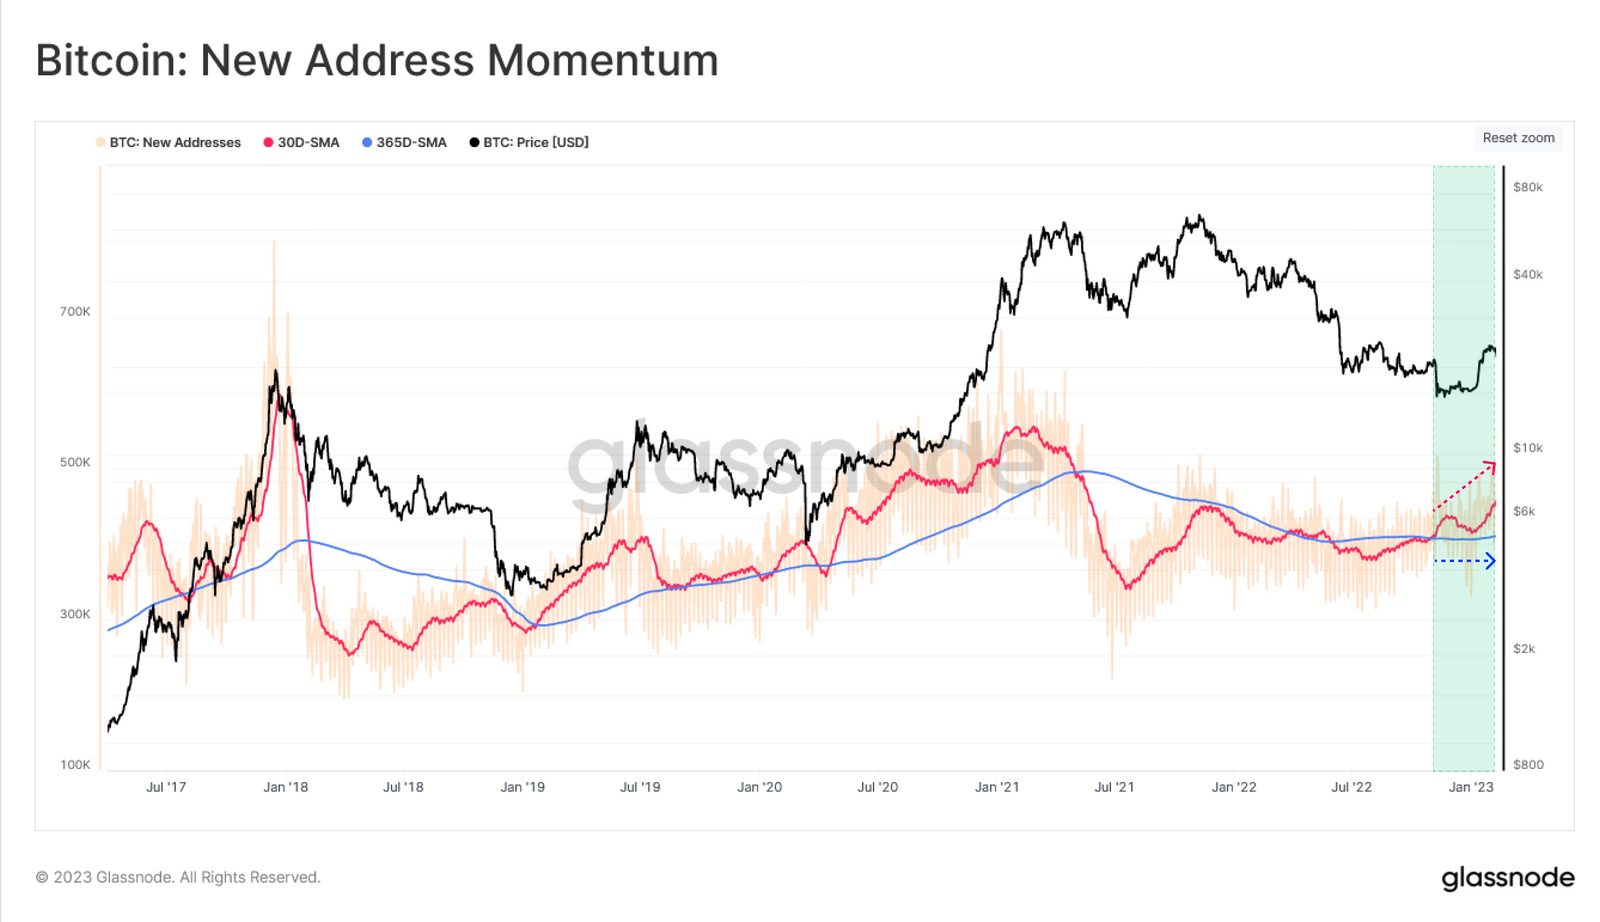
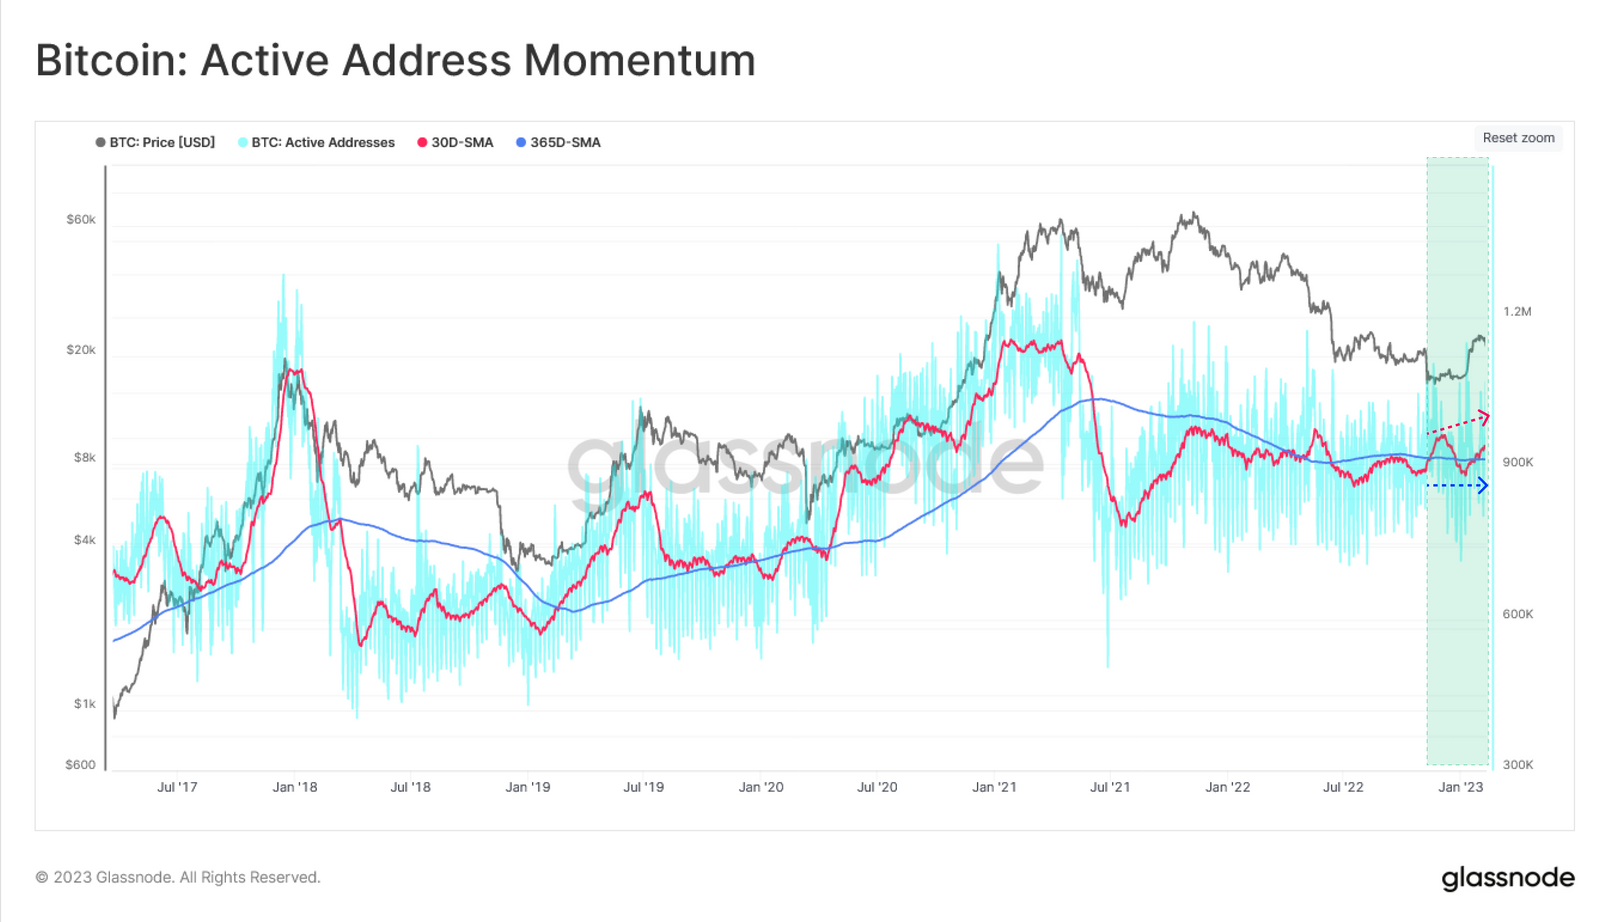
There is a much more noteworthy change in the number of both New and Active on-chain Addresses, which track macro changes in network activity. The following analysis compares the monthly moving average 🔴 with the yearly moving average 🔵 of these metrics.
The monthly average of the New Addresses joining the network has surpassed the yearly average since the capitulation event triggered by the FTX bankruptcy, which is a constructive sign. This metric has seen a second significant uptick this week, however, the longer-term moving average remains in a sideways trend, indicating this activity uplift remains in its infancy.
We can also see this slight uptick in Active address momentum, however the macro sideways trend remains largely in a holding pattern.
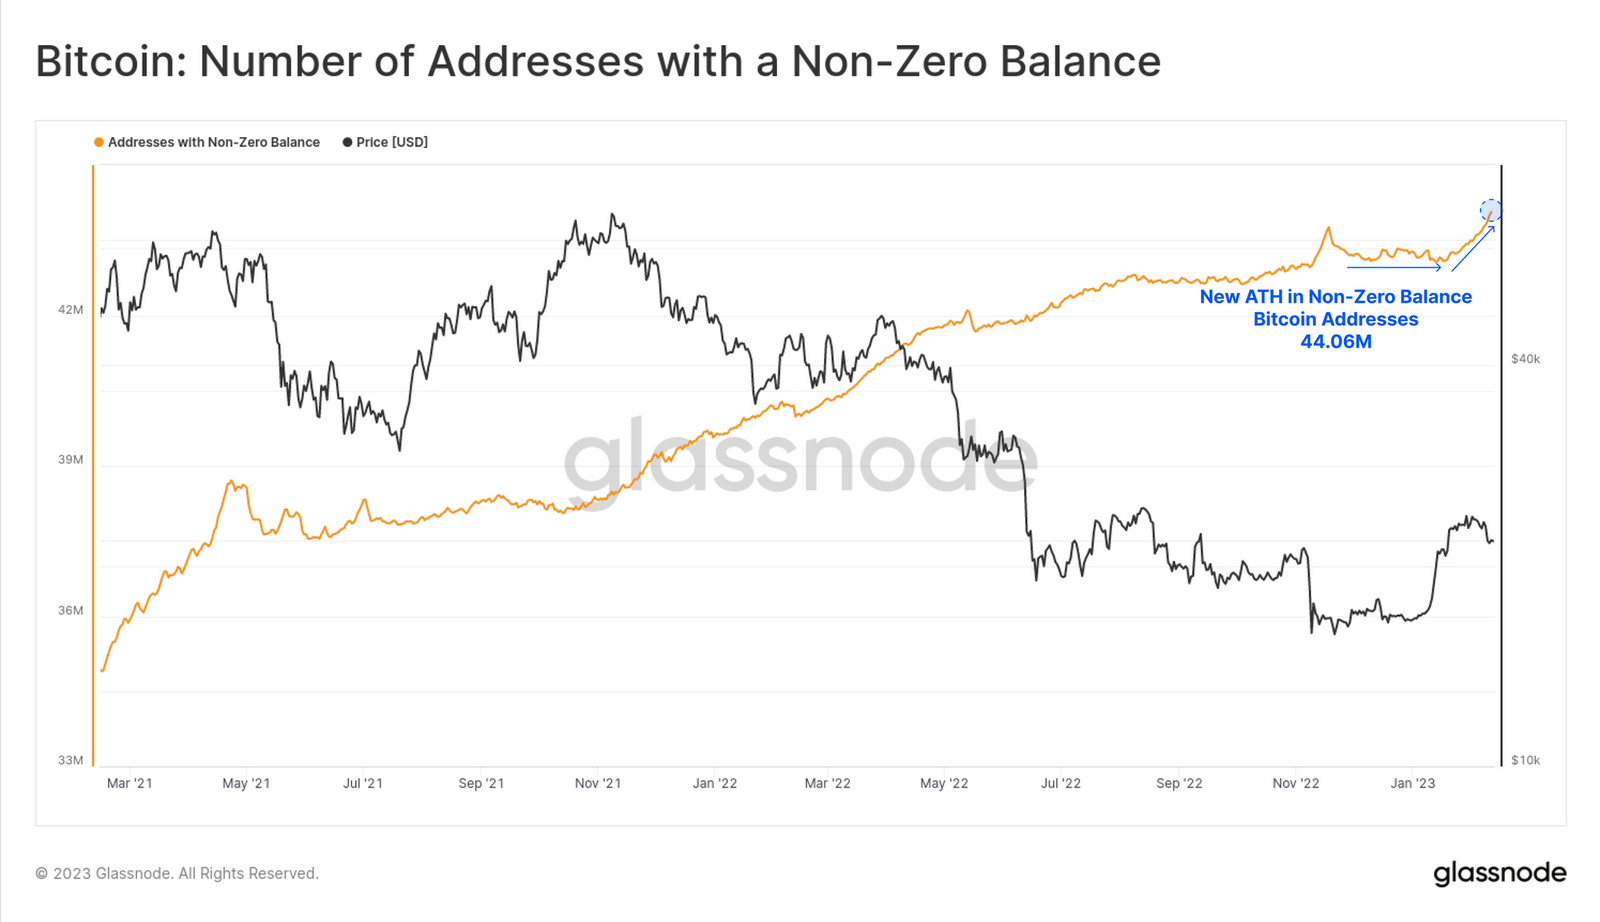
The total non-zero balance addresses however has pushed to a new all-time-high of 44.06M addresses. In aggregate, this demonstrates that there has been a short-term uptick in Bitcoin network usage of late, however it is not necessarily in terms of coin volume moved. The primary source of this activity is due to Ordinals, which instead of carrying a large payload of coin volume, is instead carrying a larger payload of data and new active users.
A New Competitor in the Fee Market
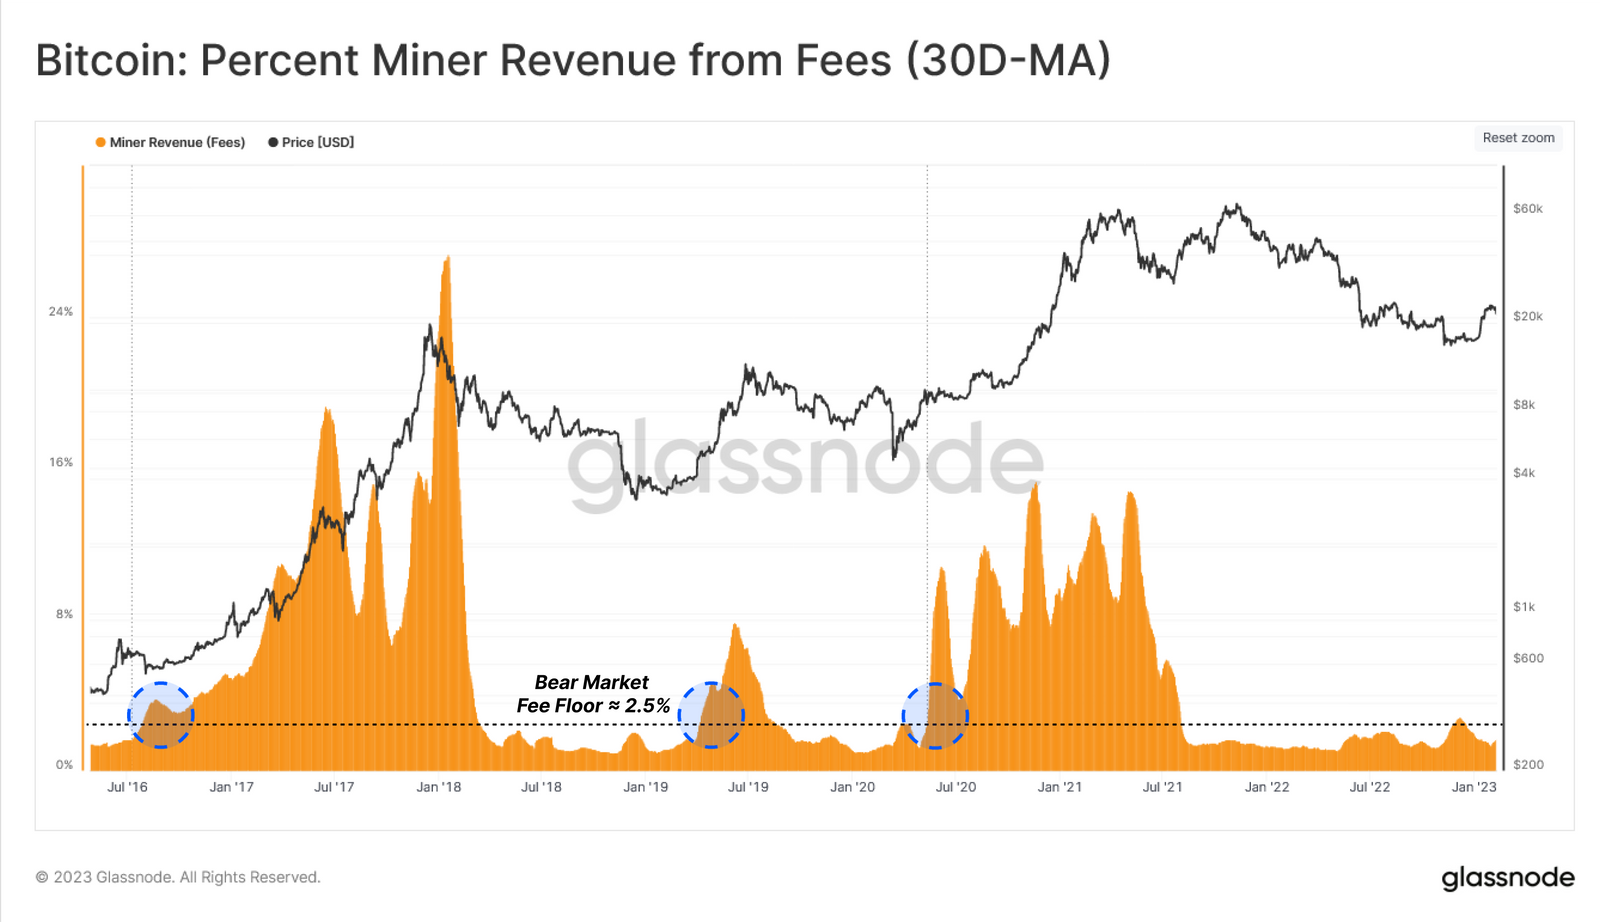
As a result of this new activity, the Bitcoin network has found a new buyer of blockspace, creating upward pressure on the fee market. Analysis of the fee market is a good gauge of higher demand for blockspace, and tends to manifest during periods of growing overall demand.
Looking at the monthly average of Miners Revenue from Fees, it is evident that this indicator has not yet surpassed the bear market fee floor rate (2.5%) 🔵 for a notable period of time.
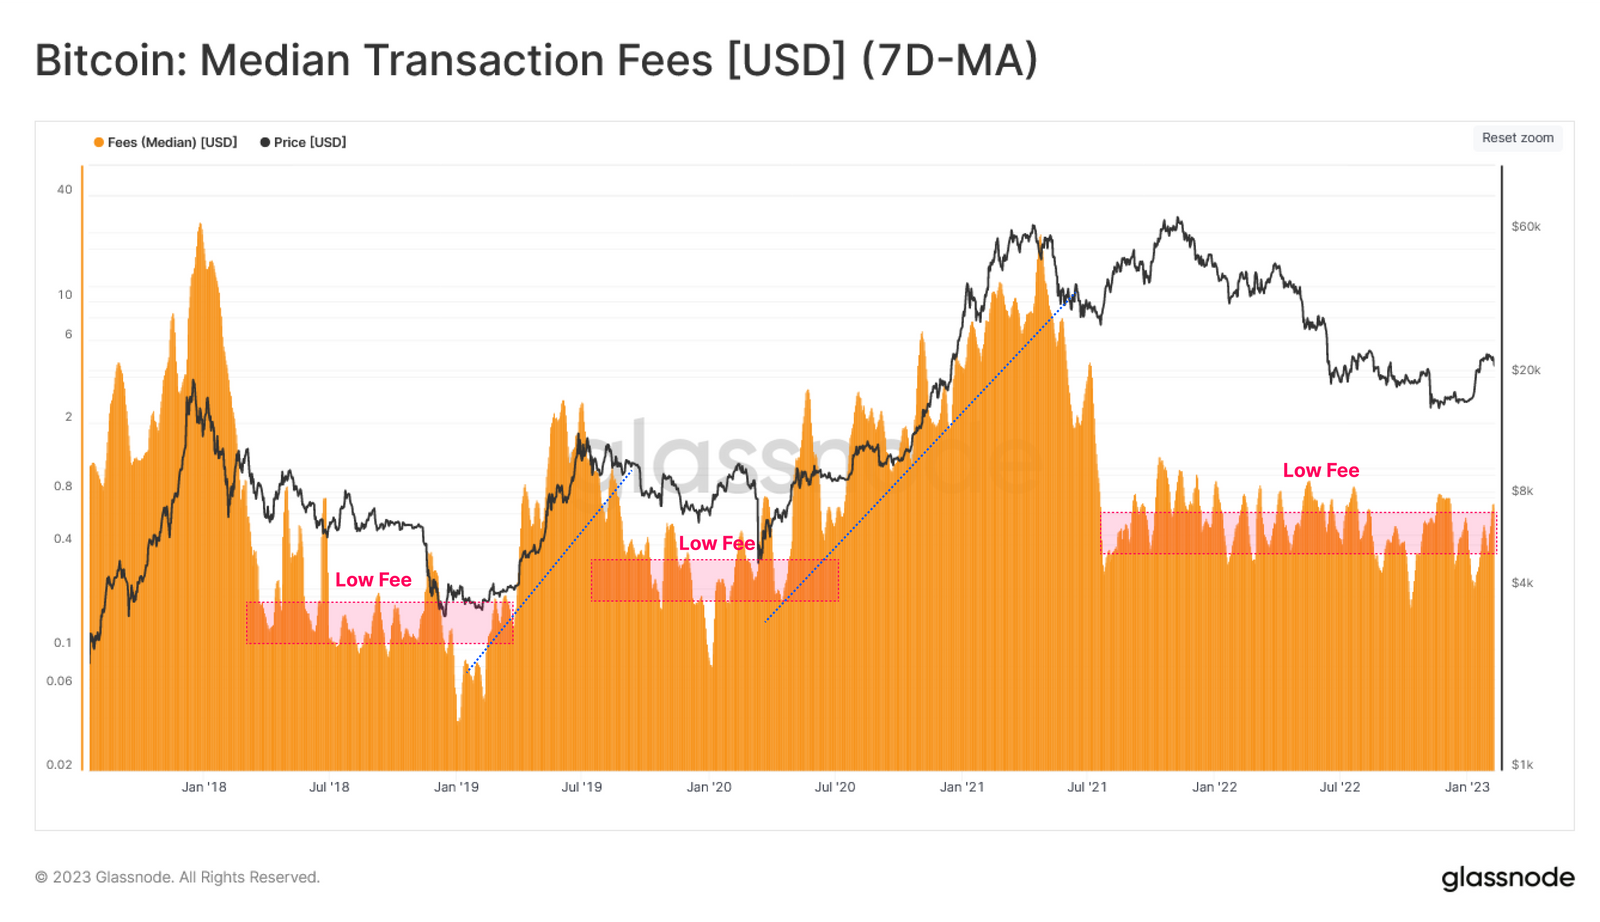
The influence of retail sized entities tends to be important for determining the sustainability of market transitions. Here, we can employ another tool to zoom on these investors effect on fee market by observing the weekly average of the Median Transaction Fee paid (denominated in USD). This a representative metric for smaller transaction fees that are most likely attributed to retail investors.
Reviewing the history of this indicator illustrates that retail investors competition for inclusion in the next block has not yet revived since the market crash after the 2021 ATH.
The Emergence of Ordinals
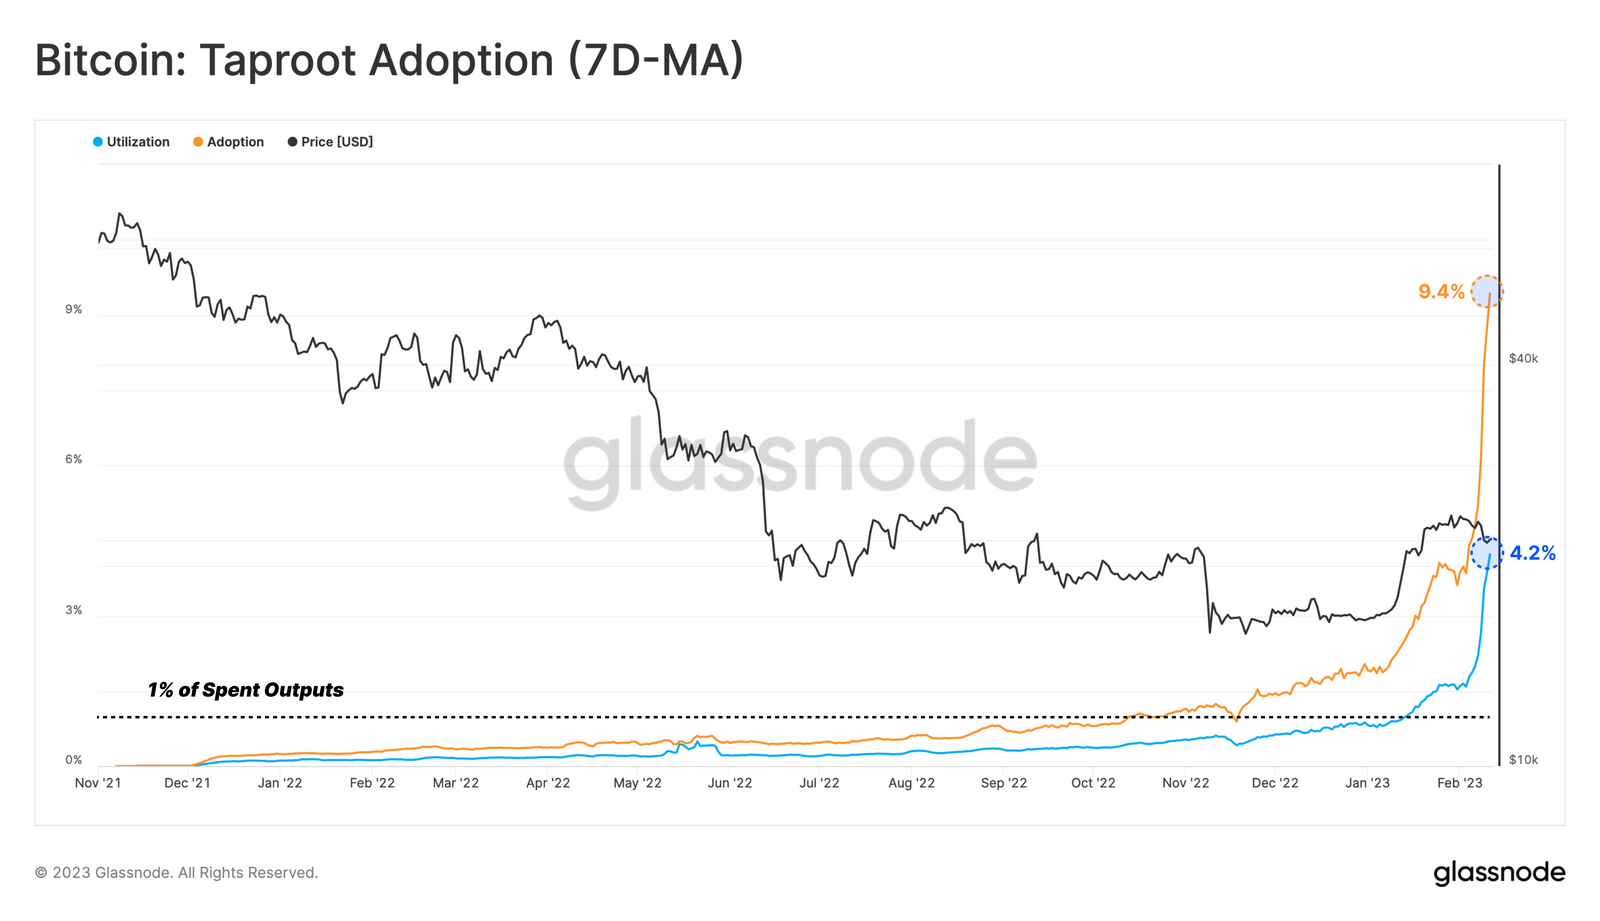
Since launching in late January 2023, the new emerging use case of Bitcoin for Ordinals and Inscriptions has inspired a great deal of discussion across the community. As Casey Rodarmor, the mind behind this innovation, described it in their blog, Ordinals leverage the Taproot soft fork, and numbering of satoshis (Serialization) to inscribe data into the witness portion of a Bitcoin transaction.
The effect of this new innovation has seen Taproot adoption and utilization spike to all-time-highs of 9.4% and 4.2% respectively (see our research piece for more information on adoption vs utilization).
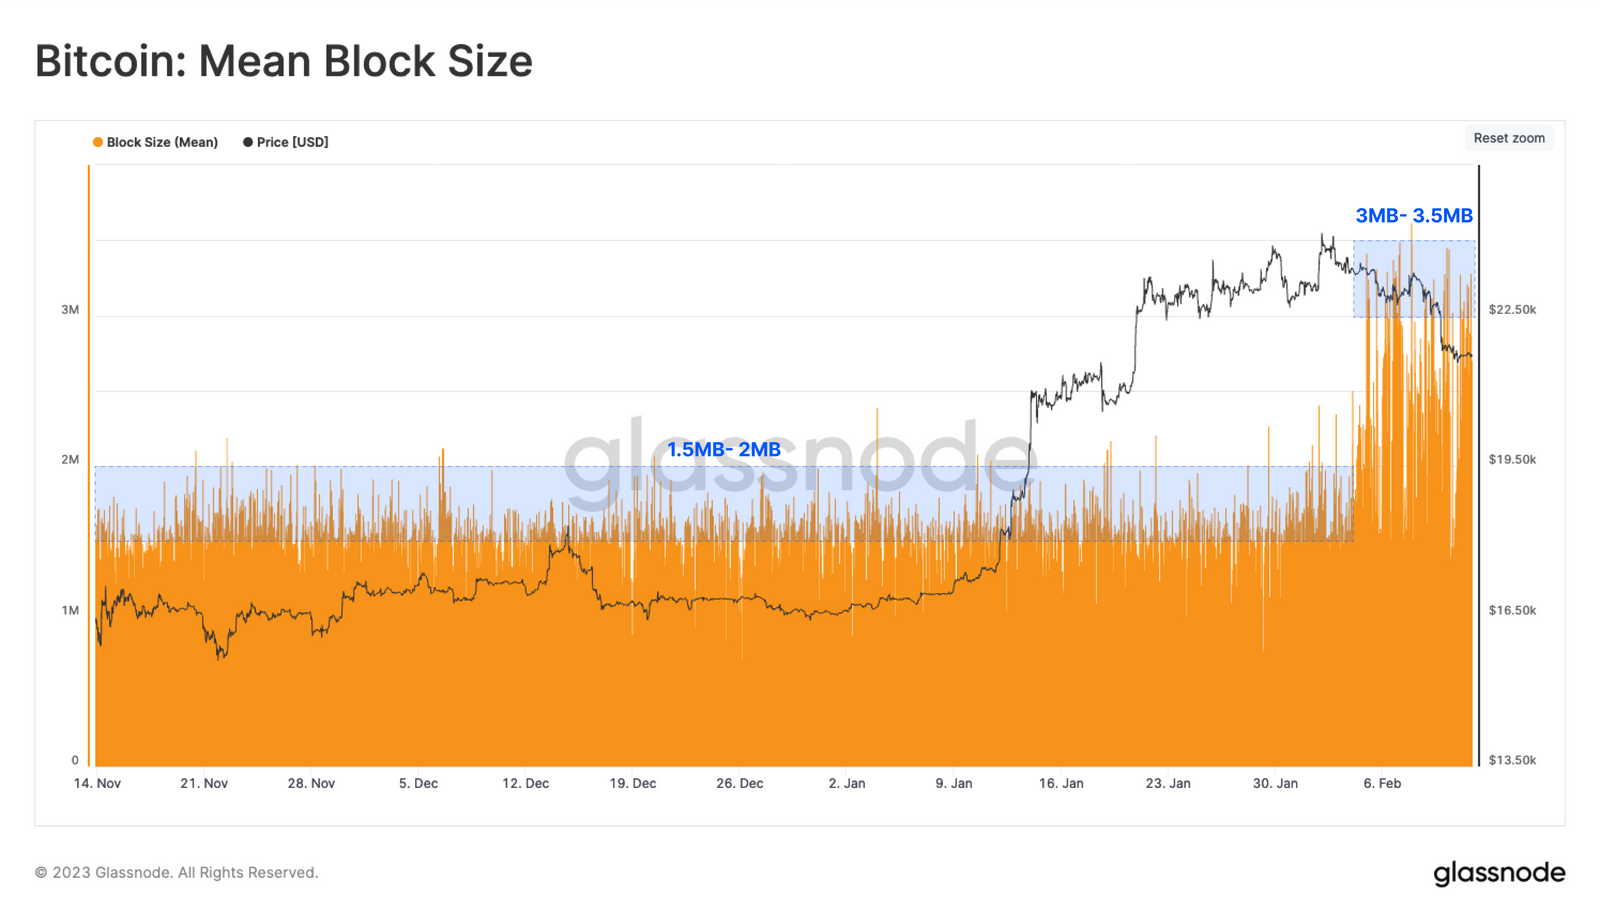
The impact of Ordinals on the Mean Block Size is also significant, with the upper range of mean block size increasing from a steady 1.5 to 2.0MB, to between 3.0 and 3.5MB over the last week.
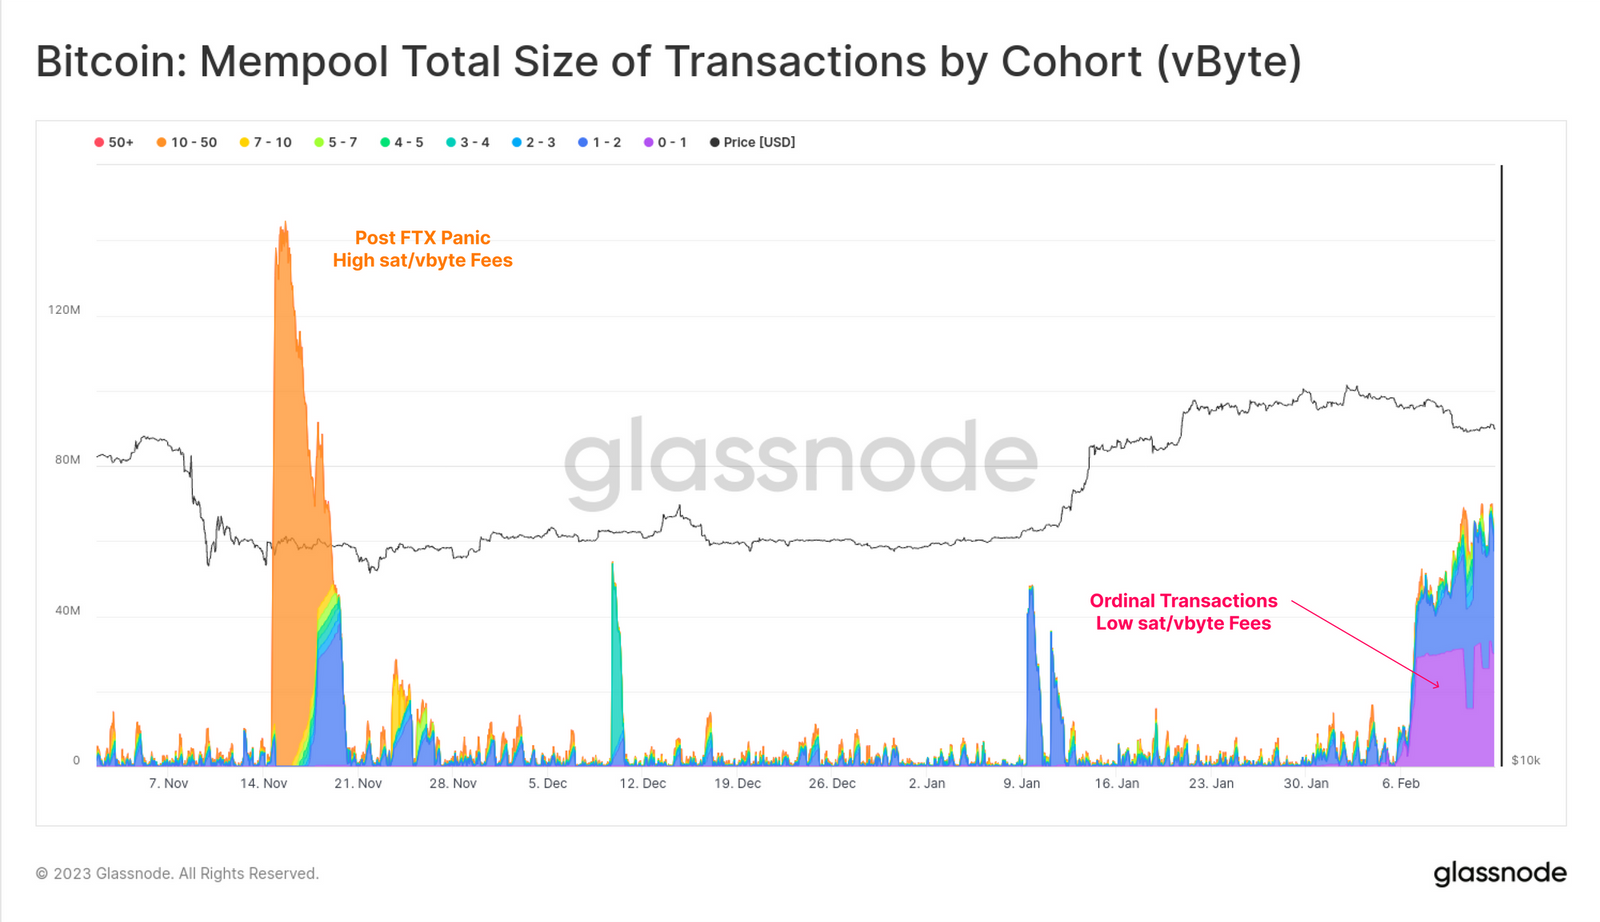
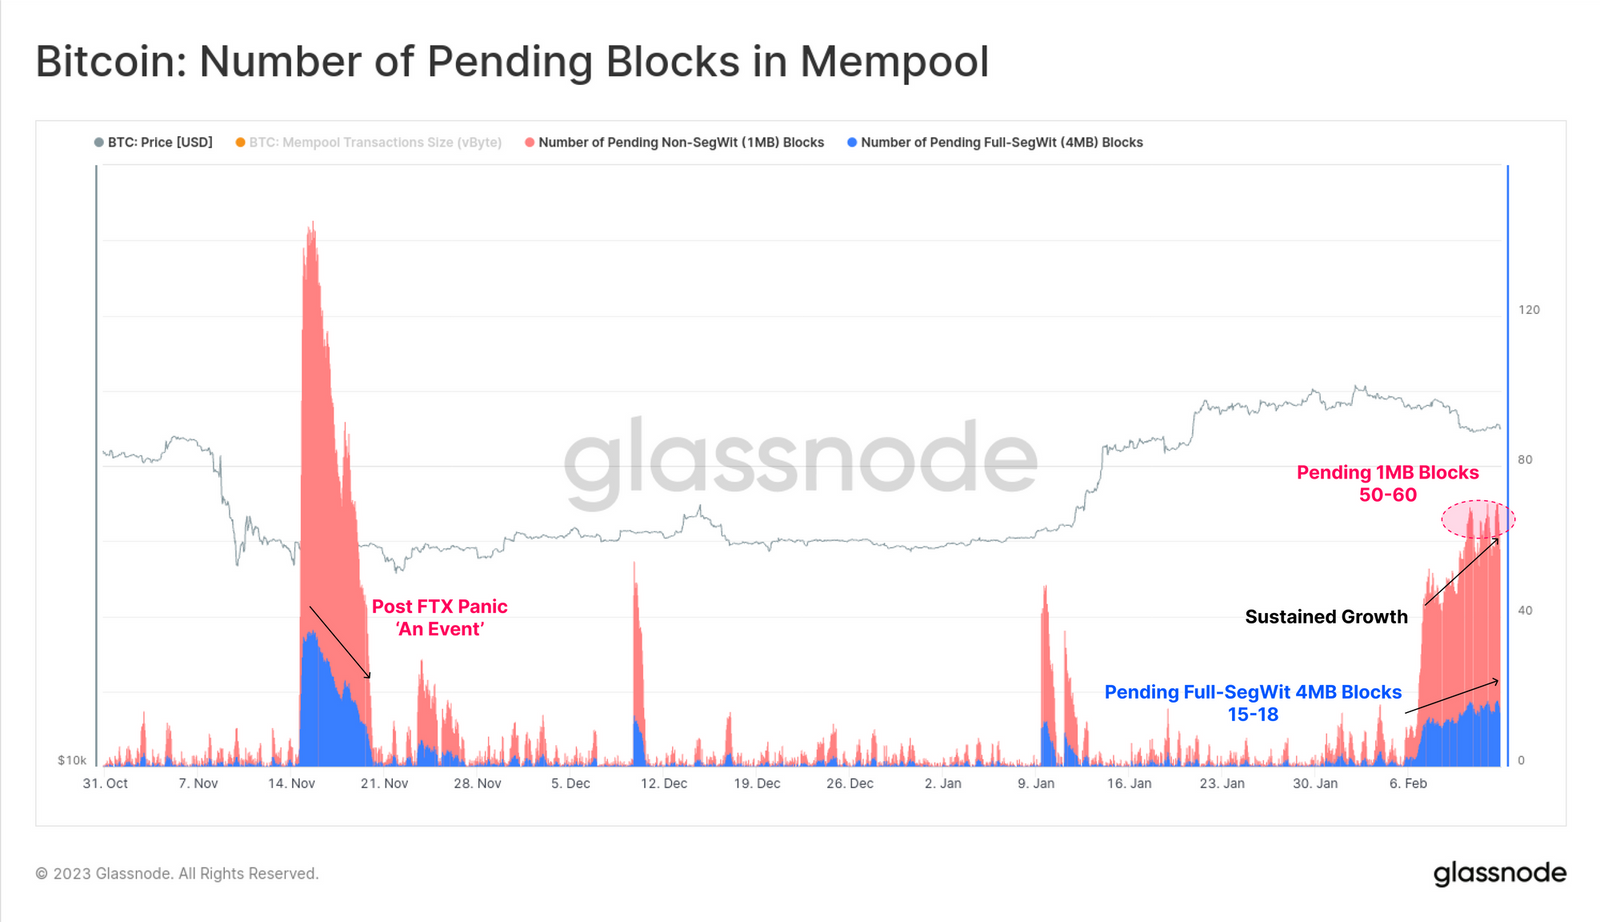
These larger blocks have stirred healthy discussions concerning the possible long-term effect of Ordinals on the Bitcoin blockchain size, initial node sync times, mempool congestion, and the state of the long-term fee market.The effect of Ordinals so far has been the setting a new lower bound transaction fee required for block inclusion. A large influx of low fee paying transactions (0 to 1sat/vbyte) can be seen hitting our mempool in purple 🟣. This differs to the post FTX panic where the mempool was filled with high urgency, high fee paying transactions shown in orange 🟠.
We can also model out the number of pending blocks required to clear the mempool assuming standard 1MB non-SegWit transactions 🔴, and full Seg-Wit 4MB blocks 🔵. We can again notice a significant difference to the post-FTX period which decayed quickly as the panic settled. With the Ordinals trend, we can actually see gradually growing demand for blockspace, having been maintained over the past week.
Conclusion
The Bitcoin network and asset has experienced numerous narratives, innovations, and events over its volatile 14yr history. The emergence of Ordinals and Inscriptions was an unexpected one, and it has manifested as a non-trivial expansion in demand for blockspace, even though it may not be the classic transfer of coin wealth between investors.
This is a new and unique moment in Bitcoin history, where an innovation is generating network activity without a classical transfer of coin volume for monetary purposes. This describes a growth in the user base and an upwards pressure on the fee market from usage beyond the typical investment and monetary transfer use cases. Ordinals are a new frontier, and one that we will be studying more deeply over coming weeks, to observing how it affects and manifests in both on-chain network, and investor behavior.