Bit Analyst
12/05 08:33
Price Analysis December 4 BTC, ETH, XRP, SOL,
Price Analysis December 4
BTC, ETH, XRP, SOL, DOGE, ADA, AVAX
Bitcoin BTC has been consolidating close to $100,000 for a few weeks and data indicates that every minor dip is being purchased. According to data from SoSoValue, United States-based spot Bitcoin exchange-traded funds witnessed inflows of $676 million on Dec. 3.
Capriole Investments founder Charles Edwards said in a post on X that institutional demand for Bitcoin has gone insane, resulting in 13.5% of all Bitcoin being held by institutions and ETFs.
Bitcoin price analysis
Bitcoin has formed a symmetrical triangle pattern, indicating indecision between the bulls and the bears.
The upsloping 20-day exponential moving average ($92,992) and the relative strength index (RSI) in the positive zone indicate the bulls have the edge. A break and close above the triangle increases the possibility of a rally above $100,000. The BTC/USDT pair may rise to $113,331 and, after that, to $125,000.
The advantage will tilt in favor of the bears on a break and close below the triangle. That could start a decline to $90,000 and later to $85,000. If the supports crack, the decline could extend to the 50-day simple moving average ($81,543).
Ether price analysis
Ether ETH turned up from the downtrend line on Dec. 3, indicating that the bulls are trying to flip the level into support.
The upsloping moving averages and the RSI near the overbought zone suggest that the path of least resistance is to the upside. The ETH/USDT pair could rise to $4,000 and later to $4,094. Buyers are expected to encounter solid selling at $4,094.
This optimistic view will be negated in the near term if the price turns down and breaks below the 20-day EMA ($3,436). Such a move will signal a lack of demand at higher levels. The pair may then slump to the 50-day SMA ($2,991).
XRP price analysis
XRP XRP has been in a strong uptrend, but the rally stalled at $2.91 on Dec. 3, suggesting profit booking by the bulls.
The first support on the downside is the 38.2% Fibonacci retracement level of $2.28. If the price rebounds off this support, the bulls will make one more attempt to resume the uptrend by pushing the XRP/USDT pair above $2.91. If they can pull it off, the pair could surge toward $3.84.
Contrary to this assumption, if the $2.28 support cracks, the pair could fall to the 50% retracement level of $2.09 and later to the 61.8% retracement level of $1.90. A deeper pullback could delay the start of the next leg of the uptrend.
Solana price analysis
Solana SOL turned up from $215 on Dec. 3, indicating that the bulls are fiercely defending the breakout level of $210.
The 20-day EMA ($230) has flattened out, and the RSI is just above the midpoint, indicating a possible range formation in the near term. The SOL/USDT pair could swing between $210 and $248 for a few days.
A break and close above $248 could open the doors for a rally to $264. The bears are expected to defend the $264 level with all their might because a rally above it could propel the pair to $300.
On the downside, a slide below the 50-day SMA ($202) will indicate that the bears have seized control.
Dogecoin price analysis
Dogecoin DOGE rebounded off the support line of the ascending channel pattern on Dec. 3, signaling buying at lower levels.
The upsloping moving averages and the RSI in the positive territory indicate that bulls have the upper hand. Buyers will try to push the price toward the resistance of the range, where the bears are likely to step in.
If the bounce fails to sustain, it will suggest that the bears are selling on minor relief rallies. That increases the risk of a break below the channel’s support line. If that happens, the DOGE/USDT pair could slide to $0.33 and later to the 50-day SMA ($0.27).
Cardano price analysis
The long wick on Cardano’s ADA Dec. 3 candlestick shows that the bears aggressively sold the rally above $1.25.
A positive sign in favor of the bulls is that they have not ceded much ground to the bears. This suggests that the buyers anticipate the up move to continue. If the price breaks above $1.33, the ADA/USDT pair could surge to $1.50.
Conversely, if the price turns down and breaks below $1.14, it will signal that the bulls are losing their grip. The pair could pull back to the 20-day EMA ($0.96), where the bulls and the bears are likely to witness a tough battle.
Avalanche price analysis
Avalanche AVAX surged above the $51 overhead resistance on Dec. 2, indicating that the bulls are in command.
The bears tried to pull the price back below $51 on Dec. 3, but the bulls held their ground. This suggests that the bulls are trying to flip the $51 level into support. If they succeed, the AVAX/USDT pair could rally to $60 and subsequently to $65.
If bears want to prevent the upside, they will have to swiftly pull the price back below $51. The pair may then slump to the 20-day EMA ($42.63), which is expected to act as a strong support.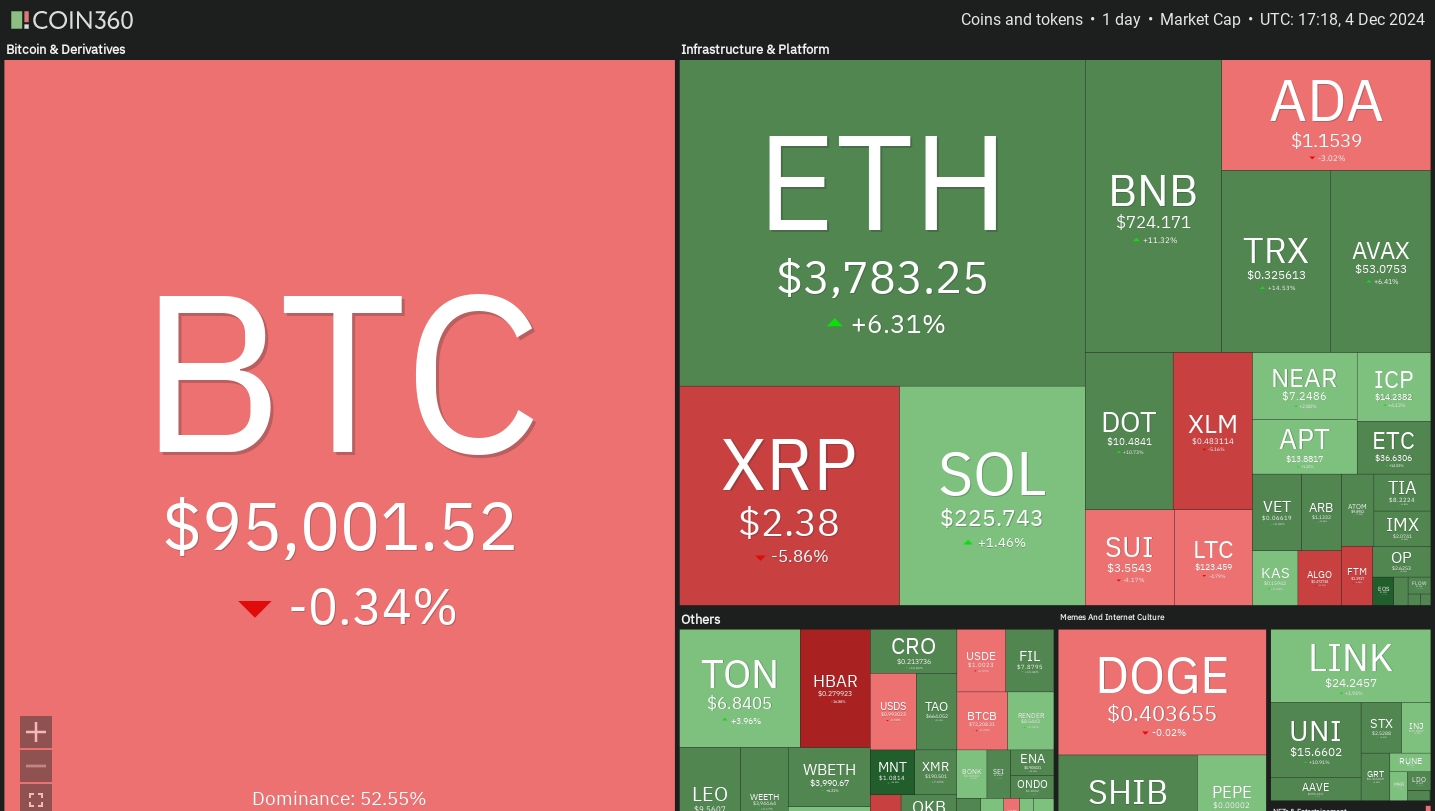
#Win 200 USDT: Share Your Take on HTX’s Q1 Report#Hit March's Interaction Leaderboard#Share Crypto Stories to Win 400 USDT#Split 500 USDT: Share Your Thoughts on BOME
4Share
All Comments0LatestHot