

Mr4Beast
2024/04/15 18:52
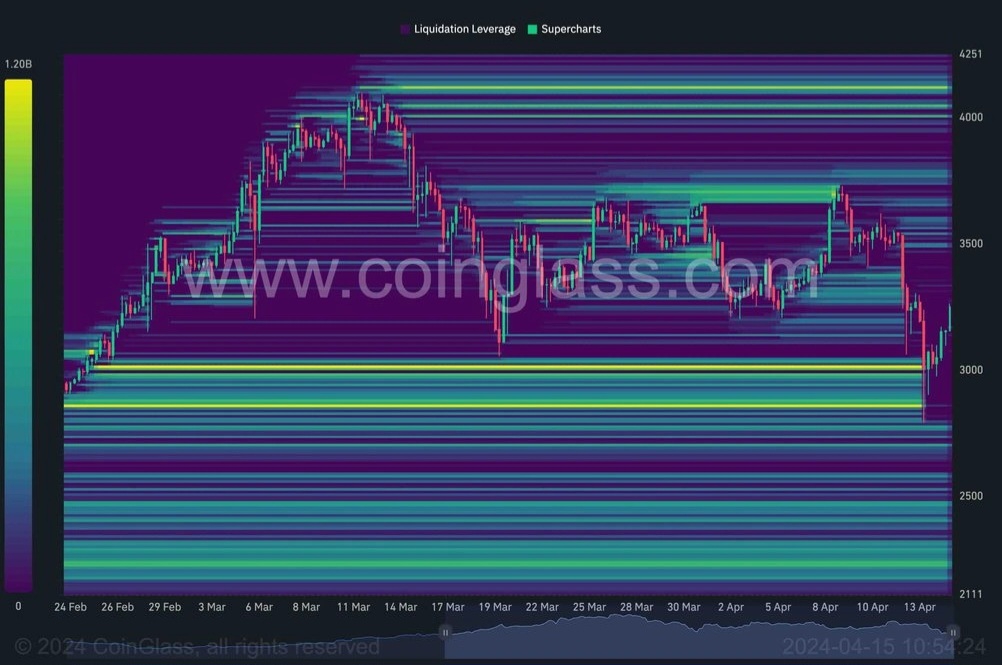
Ethereum Liquidation Heatmap
During the weekend, the price briefly dropped below the $3,000 support level. This area can be considered a critical zone from a technical analysis standpoint. Therefore, many investors might have put their stop losses there.
This chart demonstrates the HTX ETH/USDT pair’s liquidation heatmap. The price’s decline below the $3,000 level has liquidated a considerable portion of the long positions.
As the cryptocurrency is currently recovering, it can be assumed that the selling pressure resulting from these liquidations has been met with sufficient demand, and the recent drop might have been a bear trap. Therefore, the market can target liquidity above the $4,000 level if nothing unexpected happens in the short term.
#Claim 1,000 U in the June Challenge#Explore TOKEN2049 SG on HTX#Stablecoins: USDT\UST\USDD
21Share
All Comments0LatestHot
No records