Mr 420
03/03 18:31
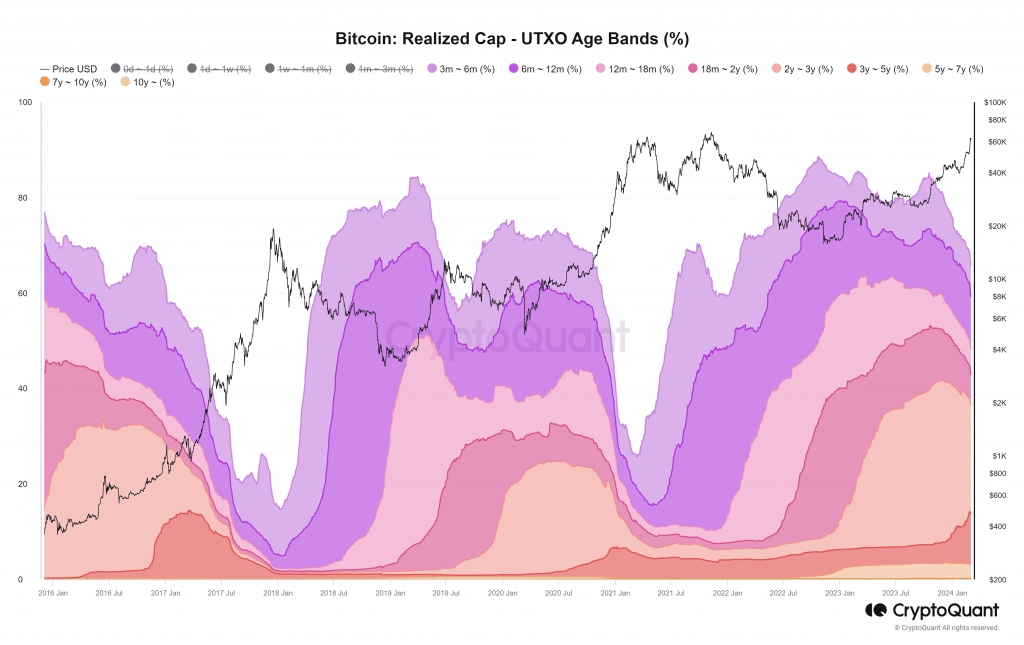
Exploring the Realized Cap-UTXO Age Bands
The chart summarizes the capitalization held by short-term and long-term holders. The second half of 2017’s bull run saw the age bands of everyone from 3 months to 5 years trend downward.
Similarly, 2021 also saw a similar downtrend. The rationale is simple- more holders are taking profits as prices climb higher. While it’s not possible to point out when the bull run would end using this metric, it’s relatively easy to spot its beginning.
The rapid pace at which 3 to 6-month holders and the 6 to 12-month holders age bands declined since mid-January is similar to the bulls runs of 2017 and 2021.
#Claim 1,000 U in the June Challenge#HTX Talks#Influence of ETH's fork on ETC
20Share
All Comments0LatestHot