

Zain khan
2023/07/05 17:00
Other Rainbow Charts The Ethereum Rainbow Chart
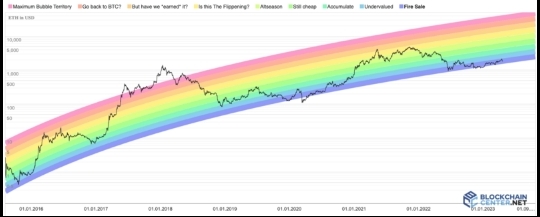
Like the Bitcoin Rainbow Chart, the Ethereum Rainbow Chart uses a color-coded system to indicate different price levels. The chart typically features nine colors, each corresponding to a specific price range and investment strategy.Conclusion
The Bitcoin Rainbow Chart is a visual tool for making informed decisions about when to buy, hold, or sell bitcoin. The chart provides a quick snapshot of bitcoin's price relative to historical price trends and can help investors identify potential buying or selling opportunities. When using the Bitcoin Rainbow Chart, beyond understanding each color band, investors should also should determine their investment goals and risk tolerance.
However, it's important to note that the Bitcoin Rainbow Chart is not a perfect predictor of future market conditions, and investors should not rely solely on it for investment decisions. The chart also comes with limitations, such as its reliance on historical price trends and subjective color coding, and investors should do their own research before investing in any digital assets.
As always, this article is not intended as financial advice and is only provided for information purposes.
#How much impact will CEO’s arrest have on TON?#Are you bullish on Bitcoin?
2Partilhar
Todos os comentários0Mais recentePopular
Sem registos