

Bit360
09/11 05:48
Bitcoin Price Action Leads to a Potential
Bitcoin Price Action Leads to a Potential Symmetrical Triangle Breakout
As of September 10, Bitcoin price was trading around $112,236, still moving in an ascending symmetrical triangle pattern. The lower support trend line holds strong around $107,304, while resistance is at the $117,156 area, which coincides with the 0.618 Fibonacci level.
If the price is able to break the resistance, it could confirm the continuation of the bullish trend and push BTC towards the target of $123,731, as per the projected Fibonacci 1.0 extension.
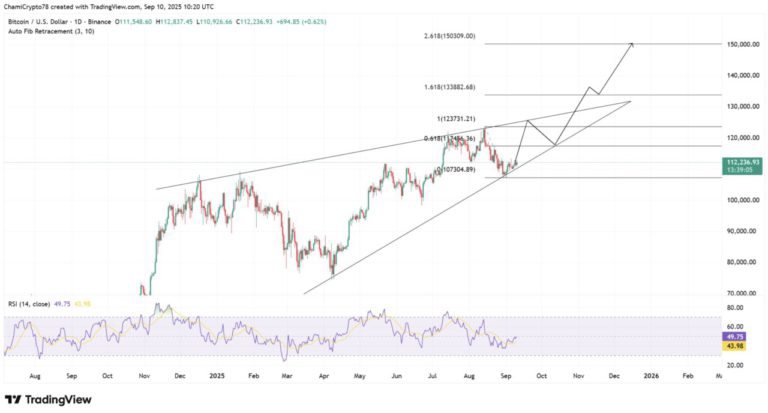
Furthermore, the chart also shows the next important level at $133.882 at the 1.618 Fibonacci extension. However, consolidation remains likely, with a potential correction to the midpoint of the triangle as a form of “healthy reset” in the uptrend.
The RSI indicator is at 49.75, higher than the signal line at 43.98, which supports a bullish bias according to the chart structure.
If the momentum continues, expansion higher remains open, with the 2,618 Fibonacci level at $150,309 reinforcing the positive long-term outlook for Bitcoin price. The resolution of this triangle pattern will determine whether BTC is capable of setting new record highs towards the end of the year.
Alle Kommentare0NeuesteBeliebte
Keine Daten