

kirani
09/02 10:49
Key Bitcoin price levels to watch Bitcoin bounced
Key Bitcoin price levels to watch
Bitcoin bounced off the lower boundary of the descending parallel channel at $107,300 on Monday, rising 2.45% to the current levels around $110,000.
The price was fighting resistance from the upper boundary of the channel at $110,500. A daily candlestick close above this level would signal a possible breakout from the downtrend, with the next barrier at the $110,000-$117,000 liquidity zone, where both the 50-day simple moving average (SMA) and the 100-day SMA are.
Bulls must push BTC price above this area to increase the chances of a recovery toward new all-time highs. 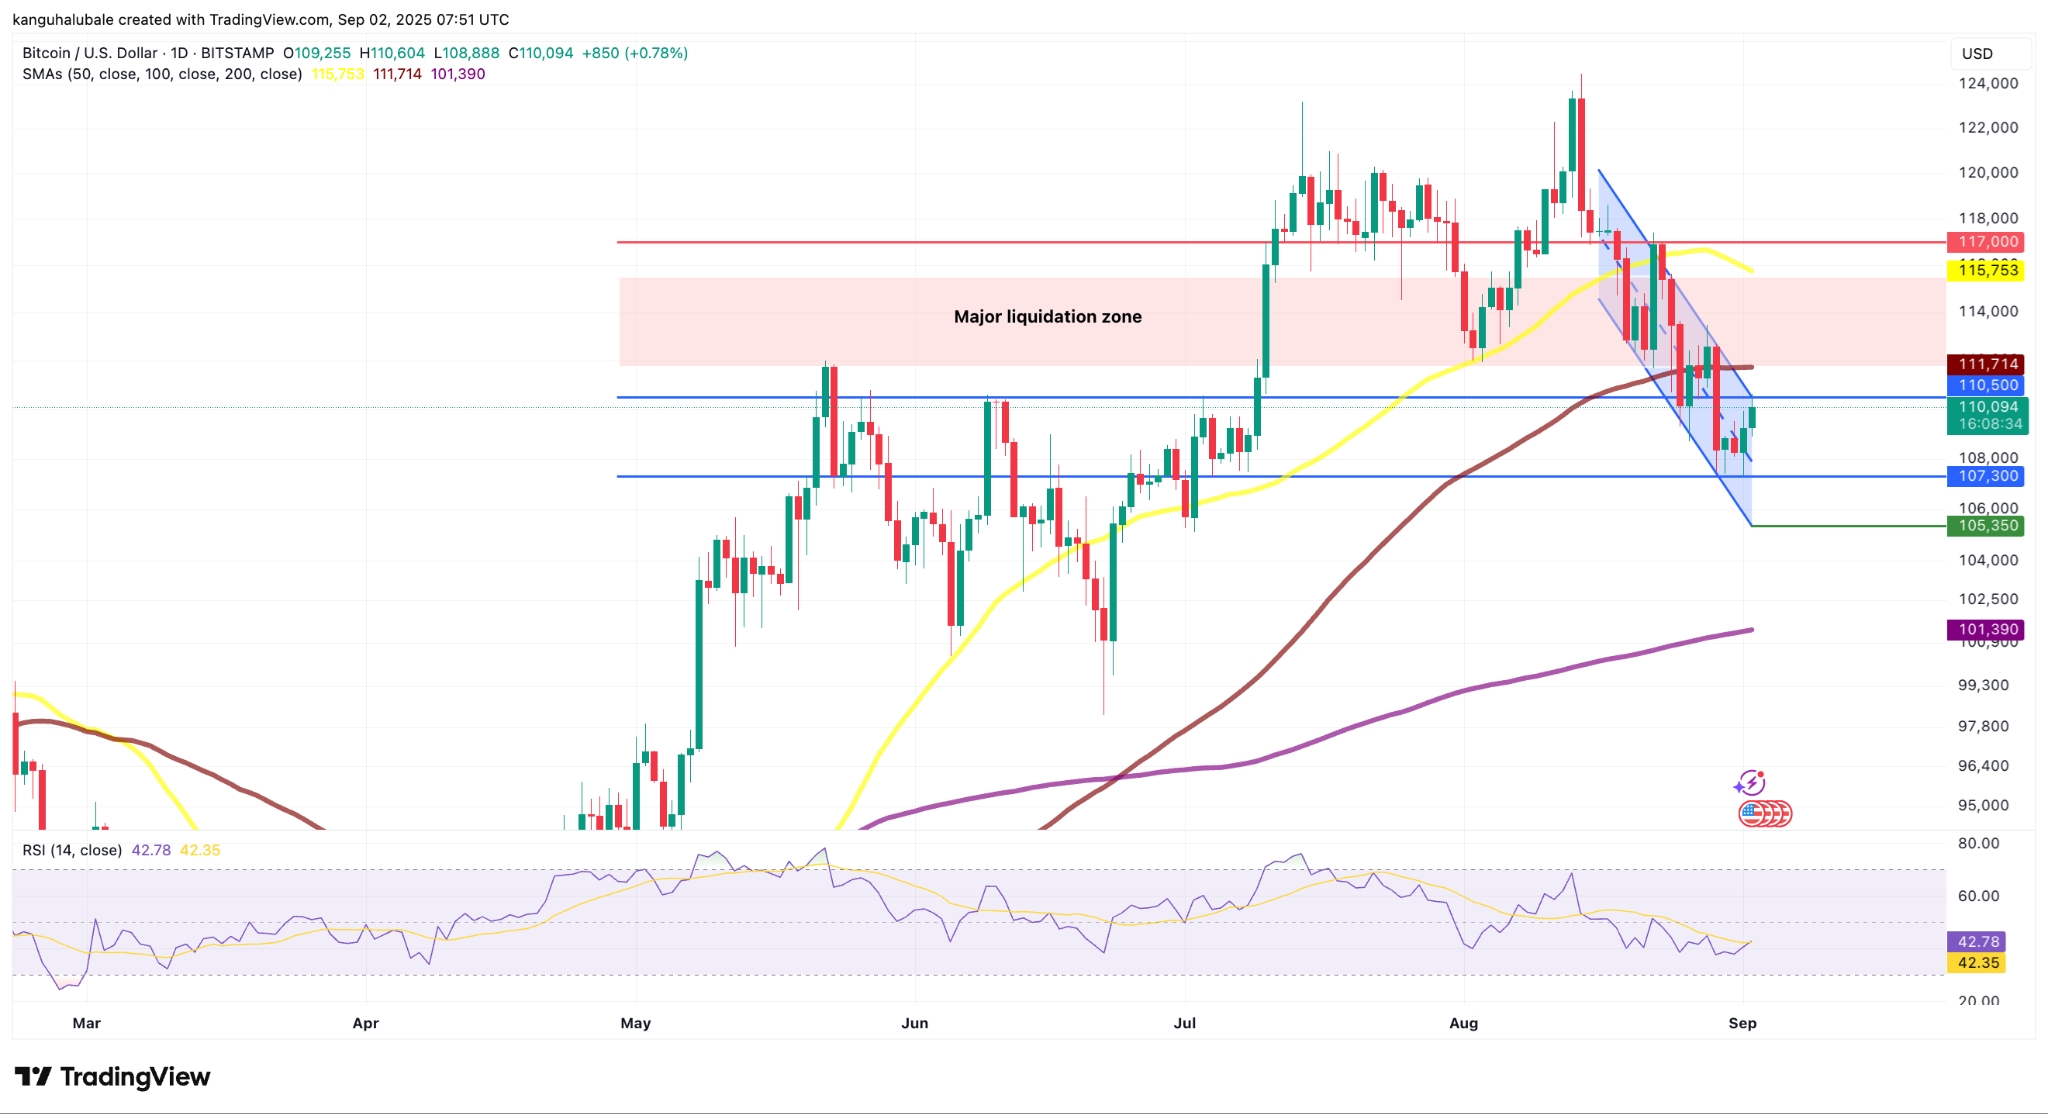
The middle boundary of the channel at $108,000 and Monday’s low around $107,300 were the immediate support levels to watch on the downside.
Below that, the channel’s lower boundary at $105,300 provided a last line of defense, which, if lost, would likely trigger a drop toward the key support level at $100,000.
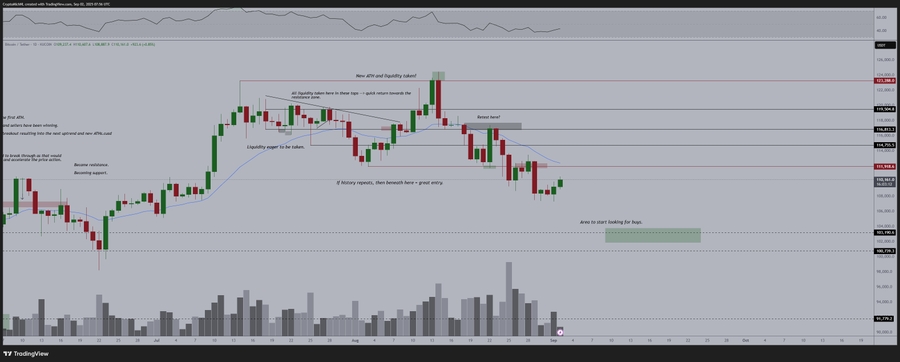
MN Capital Founder Michael van de Poppe said that a “clear break” above $112,000 was needed to take BTC to new all-time highs.
“Otherwise, I'd be looking at $103Kish for a great opportunity.“
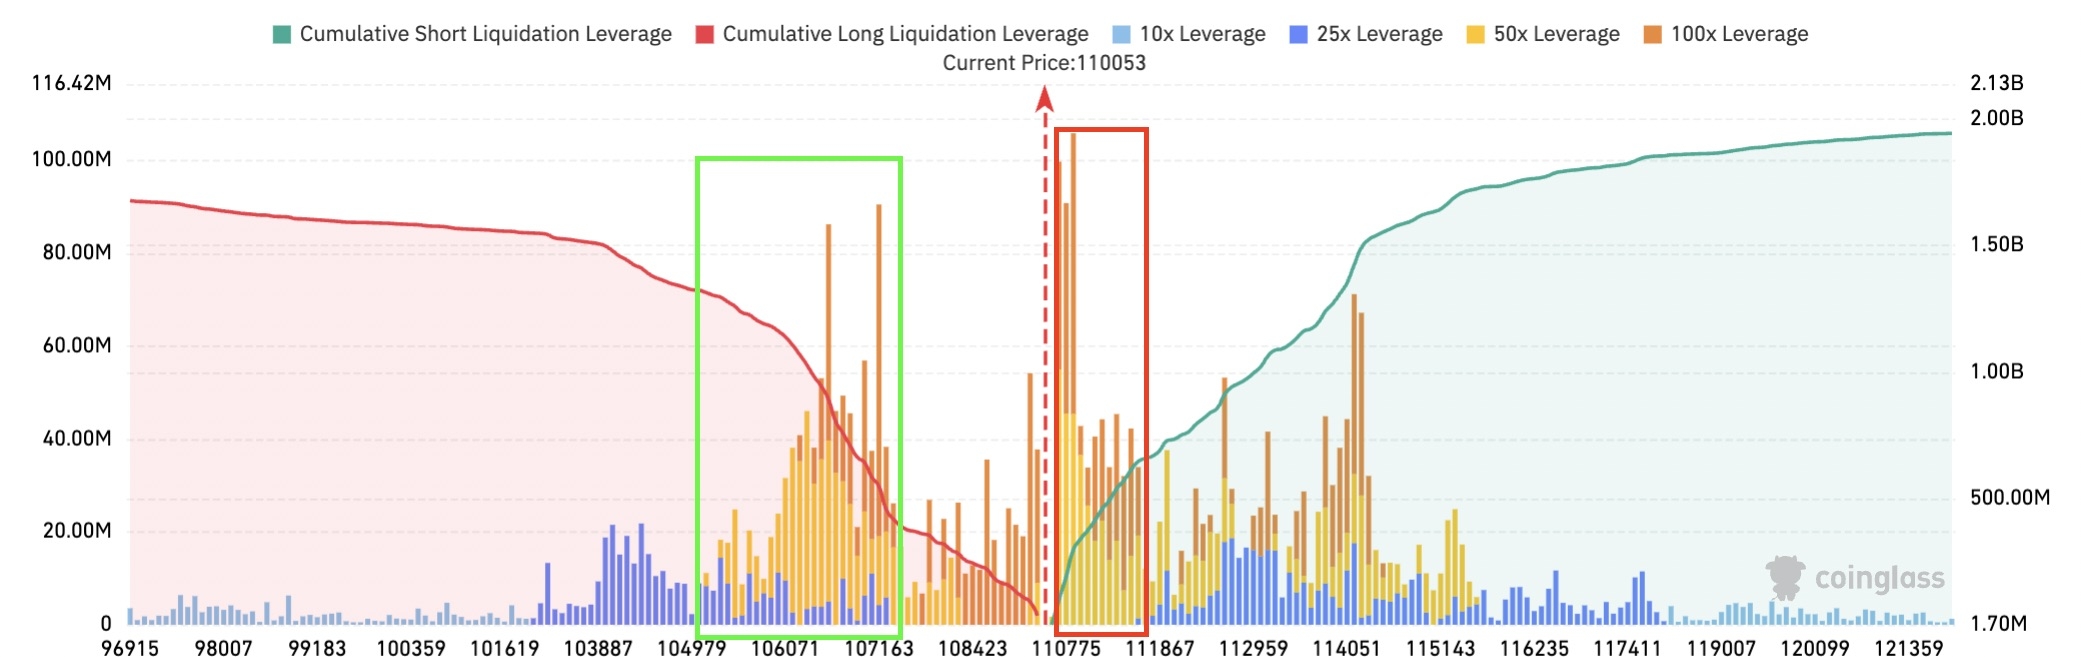
Meanwhile, the Bitcoin liquidity map revealed significant liquidity clusters between $110,000 and $111,000 on the upside, and $105,500-$107,000 below spot price.
Traders need to keep an eye out for those areas as they often act as local reversal zones and/or magnets when the price gets close to them.
Bitcoin is on a “liquidity hunt,” said analyst AlphaBTC in a Tuesday post on X, adding:
“Looks like they are coming for that big cluster of shorts 110K-111K, then likely back to run the Monday low and the longs from the weekend.”As Cointelegraph reported, Bitcoin needs to quickly reclaim the 20-day EMA at $112,500; failure to do so will increase the possibility of a drop to $105,000 and then to $100,000.
All Comments0LatestHot
No records