

Trading King
08/30 02:14
SHIB Technical Indicators Suggest Weak Momentum
SHIB Technical Indicators Suggest Weak Momentum
The monthly chart shows SHIB trading near the lower Bollinger Band at $0.000012, indicating the token could be oversold or undervalued. The middle band, representing the 20-month SMA, sits around $0.00002, and the upper band is at $0.00003. Tightening bands suggest volatility may expand soon, although current movement remains range-bound.
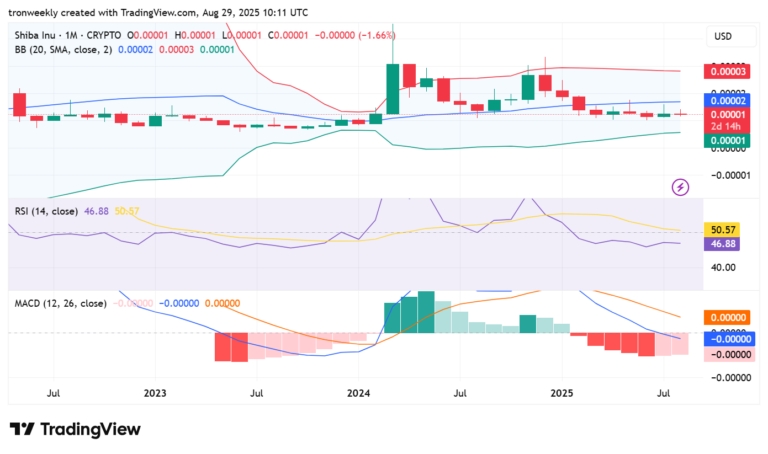
Momentum indicators remain subdued. The Relative Strength Index (RSI) is at 46.88, slightly below the neutral 50 line. This reflects mild bearish pressure without a clear oversold condition.
The MACD line is lower than the signal line, and the histogram has rising red bars. This confirms bearish momentum and a possible continuation of the trend lower, except for a sharp rise in volume.
全部评论0最新最热
暂无记录