

Trading King
08/11 16:17
Bitcoin (BTC) Price Analysis – August 11, 2025
Bitcoin (BTC) Price Analysis – August 11, 2025
Current Overview
Bitcoin has rallied above $122,000, rising approximately 2.8–3% today and pressing against its all-time high of $122,838 recorded in mid-July. This robust move reflects strong bullish momentum.
Chart Interpretation
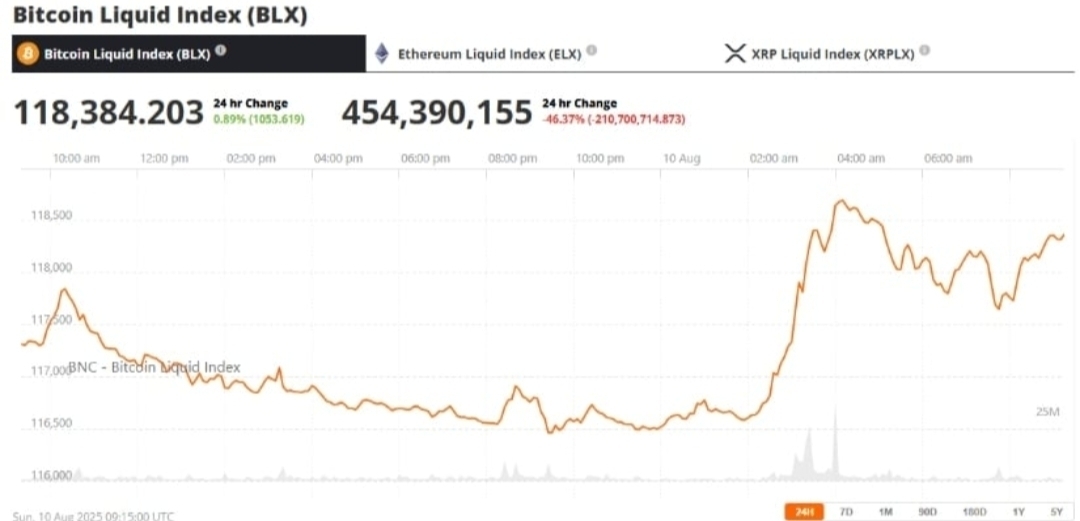
The chart above (via Brave New Coin) illustrates Bitcoin’s consolidation above $118,000, setting the stage for a breakout above $122,000. Technical indicators such as a confirmed bull-flag pattern signal tight upward momentum.
Key Drivers Behind the Rally
Institutional Demand & ETF Inflows: Strong buying pressure is evident, with record ETF inflows fueling the surge.
Favorable Macro Backdrop: Market expectations for upcoming Fed rate cuts are lending further bullish support.
Technical Spark: Bitcoin buyers are challenging the critical 1.618 Fibonacci retracement level at $122K, a historically significant resistance.
Technical Levels to Watch
Level Notes
Resistance: $122K–$123K Crucial breakout zone—crossing this could lead toward $130K–$140K.
Support: $118K Offers a base for the bull flag breakout; losing this level could prompt consolidation.
CME Futures Gap: ~$117K Gaps often get filled; Bitcoin may retrace here unless momentum remains strong.
Outlook
Short Term: If Bitcoin holds above $122K and clears $123K, a strong continuation toward $130K–$140K appears likely. Pullbacks to $118K may offer attractive re-entry points.
Mid to Long Term: The combination of institutional uptake, ETF flows, and macro tailwinds (like potential Fed easing) supports a bullish trajectory.

#Post To Earn Bonus#Win 200 USDT: Is ETH Kicking Off Altcoin Season? #Claim1,200 USDT in the Monthly Creation Challenge#Whose “child” is ES — Solana or Ethereum?#Do you think Tanssi is promising?
6공유
모든 코멘트0최신인기
기록 없음