

BTC31011
08/08 10:36
History Repeats—or at Least Rhymes—with a Break Be
History Repeats—or at Least Rhymes—with a Break Below $120,000
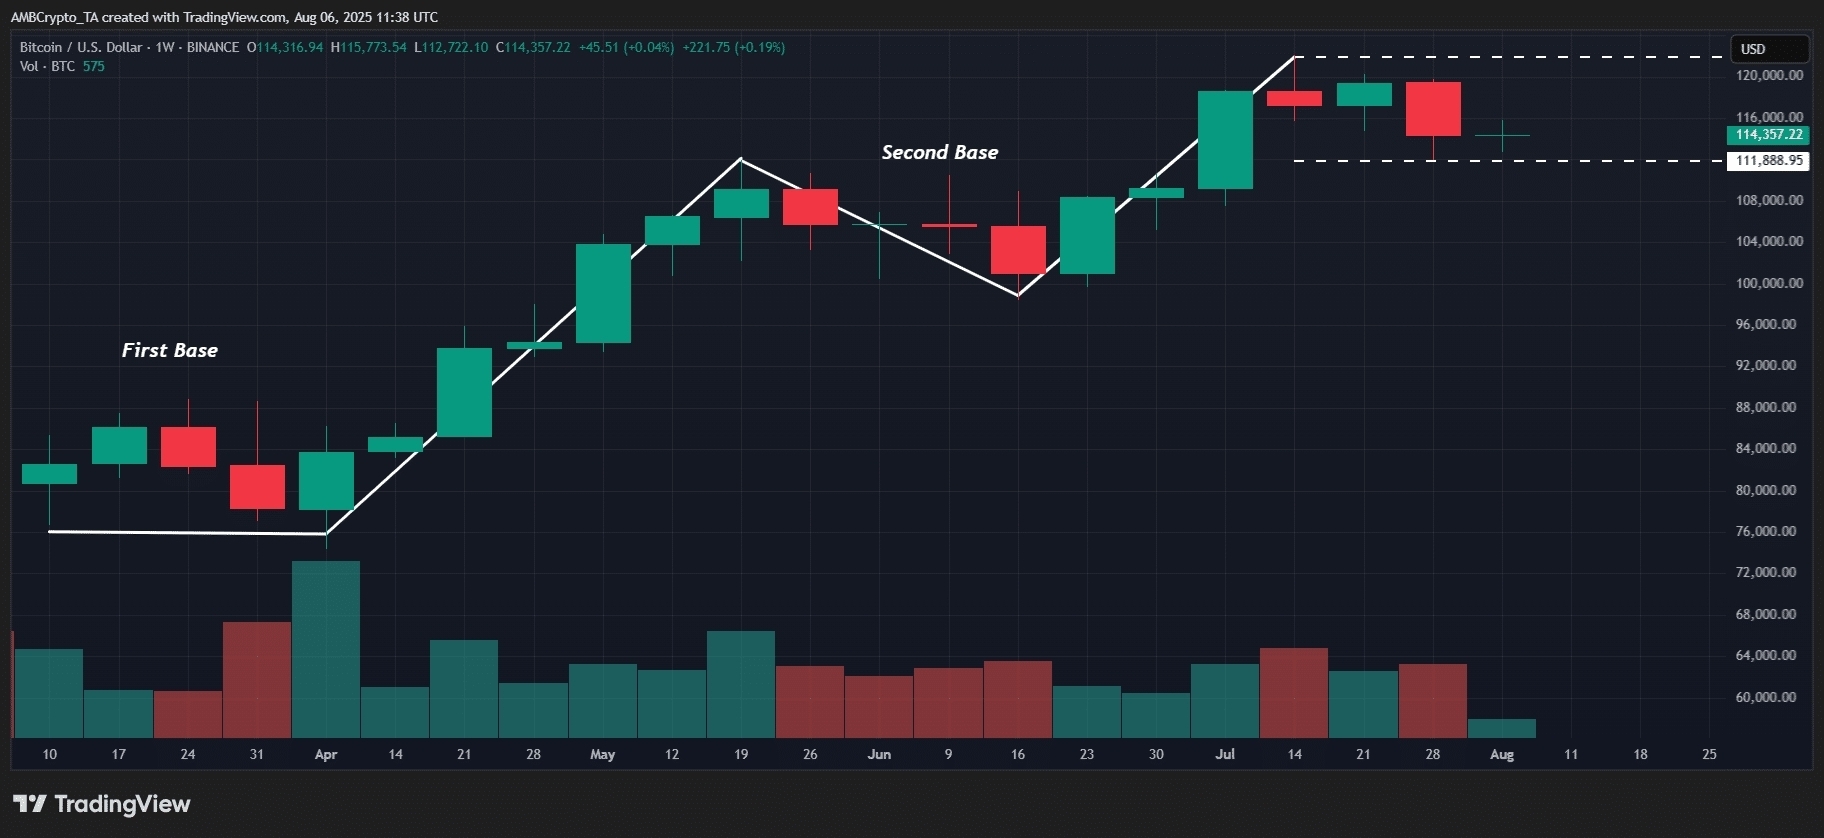
Since the beginning of the second quarter, BTC has consistently made higher lows.
The first such low, following a 5% weekly drop, established a structural bottom around $77,000, which served as the catalyst for a five-week rally to $109,000.
The second bottom formed in the demand zone between $105,000 and $109,000, ultimately breaking out to a new all-time high of $123,000. Both bottoms were followed by approximately four weeks of consolidation before rebounding.
Now, after a new weekly drop and the fourth weekly candlestick chart following the all-time high, BTC appears to have formed a similar structure again.
If the previous pattern repeats, BTC could form a third bottom in the $110,000 to $119,000 range.
Furthermore, a solid yellow liquidity cluster has begun to form around $114,500, containing nearly $24 million in short positions. A break above this level could strengthen structural support at the current BTC price.
However, if the market doesn't shift in favor of buyers, this move could persist.
Bulls would need to demonstrate significant on-chain accumulation within the range to confirm a breakout.
#Will Bitcoin fall in August?#Buy Bitcoin’s dip,’ says Eric Trump#HTX Crypto Gifts Carnival Is Live!#Whose “child” is ES — Solana or Ethereum?#BTC price hits a new high of $120,000!
4分享
全部评论0最新最热
暂无记录