trend
07/26 06:25
HBAR Price Analysis On the daily chart I shared,
HBAR Price Analysis
On the daily chart I shared, HBAR has broken above the previous resistance at $0.26, which is very close to the 23.6% Fib retracement level. This happened after the “higher low” at $0.233 was formed on July 24. That said, traders should keep an eye on the immediate support zone located between $0.2480 and $0.2520, with a more critical stop loss threshold at $0.2390.
As for indicators, the 14-day RSI is at 66.34, which is close to the overbought zone but still shows upside potential. Meanwhile, the MACD remains slightly bearish with a negative histogram (-0.00022), although the price is holding steady above its 7-day simple moving average at $0.2611.
If the bullish momentum continues, HBAR price could reach a July 25 high at $0.2976, followed by a potential breakout to $0.3274. A successful close above $0.2993 would confirm this bullish trajectory, with long-term resistance at $0.3735.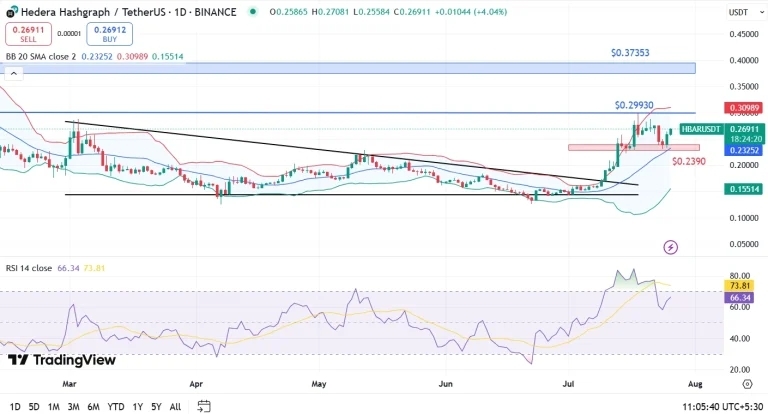
#HTX 12th-Anniversary Carnival#ETH price breaks through $4,600, buy or sell?#Check In to Win a 20g Gold Bar#Do you think MemeCore is promising?#HTX Crypto Gifts Carnival Is Live!
4分享
全部評論0最新熱門