

CryptoStar
07/17 04:56
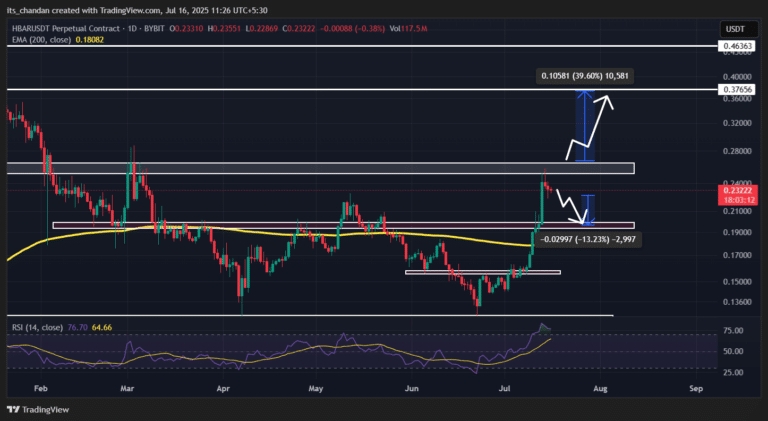
The technical analysis shows HBAR consolidating ju
The technical analysis shows HBAR consolidating just below the $0.26 resistance zone.
A breakout above $0.265 could send the price up to $0.37, marking a 39.6% rally from current levels.
However, if price fails to break out, it risks falling back to $0.22, roughly a 13% downside.
Technically, HBAR remains bullish on the higher timeframe. The asset continues to trade above the 200-day Exponential Moving Average (EMA) at $0.1808.
But traders should take note: the Relative Strength Index (RSI) remained at 78, signaling overbought territory and increasing the odds of a short-term correction before any sustained breakout.
#HTX 12th-Anniversary Carnival#HTTC S1 Team Competition Kicks Off!#Claim1,200 USDT in the Monthly Creation Challenge#Do you think DELOREAN is promising?#Do you think ANIME is promising?
26Share
All Comments0LatestHot
No records