

Crypto Express
07/16 05:52
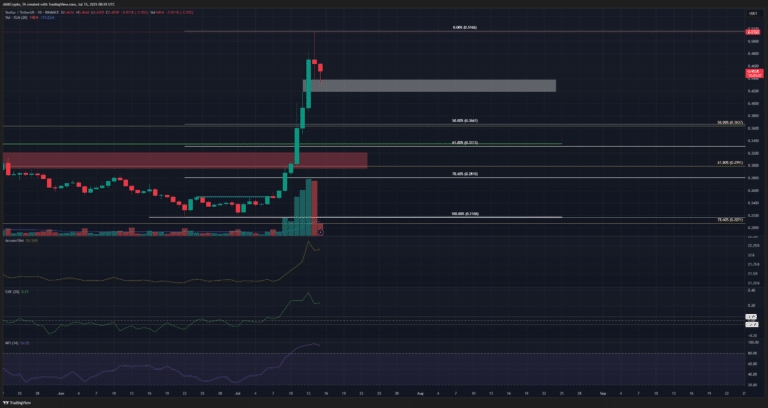
XLM 1-day chart analysis
Using the rally from the 22nd of June, a set of Fibonacci retracement levels was plotted (white). The market structure shifted bullish on the 6th of July, and high trading volume followed its swift rally to $0.516.
On the way higher, the daily chart presented some gaps. The first was at the $0.42-$0.44 area, which was being retested at the time of writing.
The A/D indicator was trending higher, showing the strong buying volume in recent days. The CMF agreed, its +0.23 reading well above the +0.05 threshold that marks sizeable capital inflow to the market.
The MFI began to recent from the 97.7 value it made on the 14th of July.
#Share Your Thoughts on Popular Assets in June#Claim1,200 USDT in the Monthly Creation Challenge#Focus on NFT
82Share
All Comments0LatestHot
No records