

Crypto Express
07/16 05:49
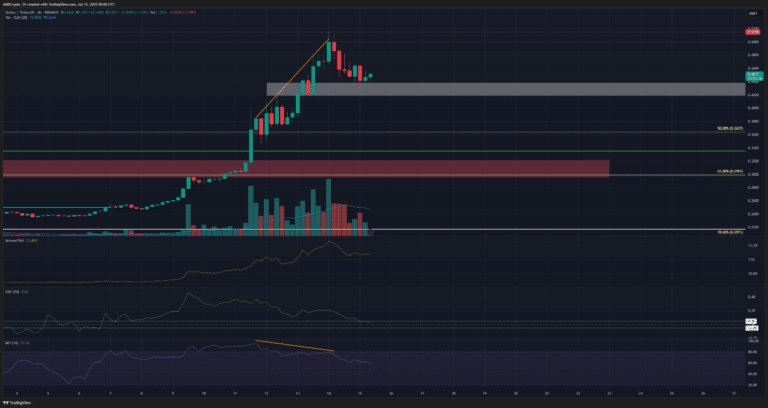
XLM 4 hour Chart analysis
While the 1-day chart showed strength, the 4-hour chart highlighted a bearish divergence. The MFI and the price, marked in orange, diverged to signal that a pullback was imminent.
This pullback saw XLM prices recede to $0.43. The CMF also fell to neutral values.
Overall, the bearish divergence has played out, seeing the XLM price revisit the fair value gap as a demand zone.
A deeper Bitcoin correction below the $116k mark could bring XLM prices lower, but until that happens, traders can maintain their bullish bias for Stellar.
#Share Your Thoughts on Popular Assets in June#Claim1,200 USDT in the Monthly Creation Challenge#Focus on NFT#Do you think DELOREAN is promising?#Do you think ANIME is promising?
96공유
모든 코멘트0최신인기
기록 없음