Crypto Express
07/13 09:44
USDT Dominance Vs ETH/BTC ratio
The buying power and rotation have been happening subtly since mid-June. Notably, the USDT dominance has dropped from 5% to 4.5% since late June.
When tracked from April, USDT.D has declined by 2.5% from 6% to 4.5%. This marked the Q2 bottom and subsequent recovery into Q3.
It meant buying pressure increased as users ditched their USDT for their favourite altcoin gems.
A similar trend was observed last November and mirrored the ETH/BTC ratio surge, too. ETH/BTC ratio surged 10% this week, an overall 19% pump since June lows.
In other words, some traders rotated from BTC to ETH, another positive sign for altcoin season.
However, at the time of writing, the ETH/BTC ratio tagged the 200-day Simple Moving Average (SMA, blue line). It has been capped at this level for the past two days.
A sustained rally above the dynamic level (200-D SMA) could confirm the capital rotation and lift the altcoin sector even further.
On the flipside, a drop in the ETH/BTC ratio could cap the altcoin market recovery. It remains to be seen whether the trend will extend. 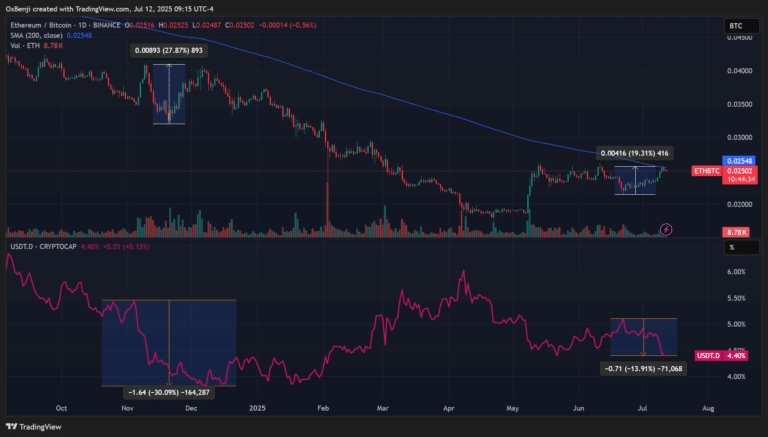
#HTX 12th-Anniversary Carnival#Share Your Thoughts on Popular Assets in June#Claim1,200 USDT in the Monthly Creation Challenge#Do you think NEWT is promising?#Do you think SPK is promising?
76Поділитися
Усі коментарі0НовіПопулярно