

加密货币最佳
07/12 06:50
Kaspa (KAS) Price Prediction for Today
Kaspa (KAS) Price Prediction for Today (July 12)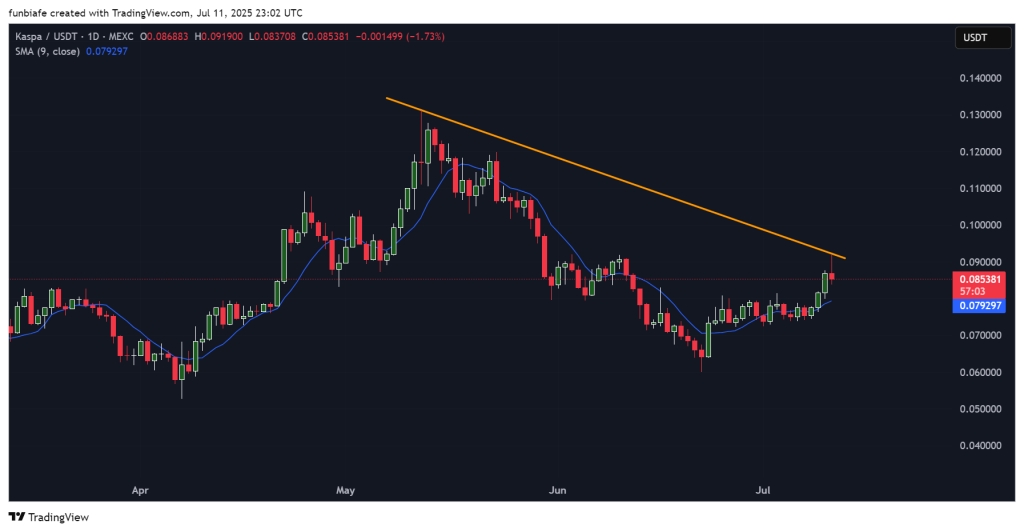
Kaspa has been making some noise lately,it’s currently trading at $0.08573, and it’s bouncing off its recent lows and pushing higher over the past week.
After testing intraday highs near $0.0919, Kaspa price failed to hold gains and has slipped back below $0.086.
The next few sessions could decide whether this recovery continues or fades back into the broader downtrend.
Let’s break it all down.
What We Got Right Yesterday
In yesterday’s prediction, we pointed out the $0.088–$0.090 zone as a key resistance area, and today’s chart respected it perfectly.
Kaspa price reached an intraday high of $0.0919 but quickly got rejected and dropped back to around $0.085.
We also mentioned that if bulls couldn’t break that level with volume, a pullback could be on the table. That’s exactly what’s starting to happen now, sellers are showing up again just as price reaches that trendline.
Kaspa Daily Overview (July 12)
Current Price: $0.0853
24h Change: -1.73%
9-Day SMA: $0.0793 (slightly rising)
Volume: Holding steady, but not breakout-worthy
Kaspa price is still trading above its 9-day moving average, which is a good sign for short-term momentum. But until it breaks above that descending orange trendline, the bigger picture still leans neutral at best.
What the Kaspa Chart Is Telling Us
Kaspa has been stuck under this trendline since mid-May. Today marked yet another rejection at that same level, that’s three failed attempts now.
Buyers have stepped up since the $0.070 bottom, but they need to push through this resistance if they want a real trend shift. Otherwise, it’s just another bounce in a bigger downtrend.
Tüm Yorumlar0En yeniPopüler
Kayıt yok