

X-2
07/11 22:27
ETH price prediction
rallied sharply from the 20-day EMA ($2,613) on Tuesday and soared above the $2,879 resistance on Thursday.
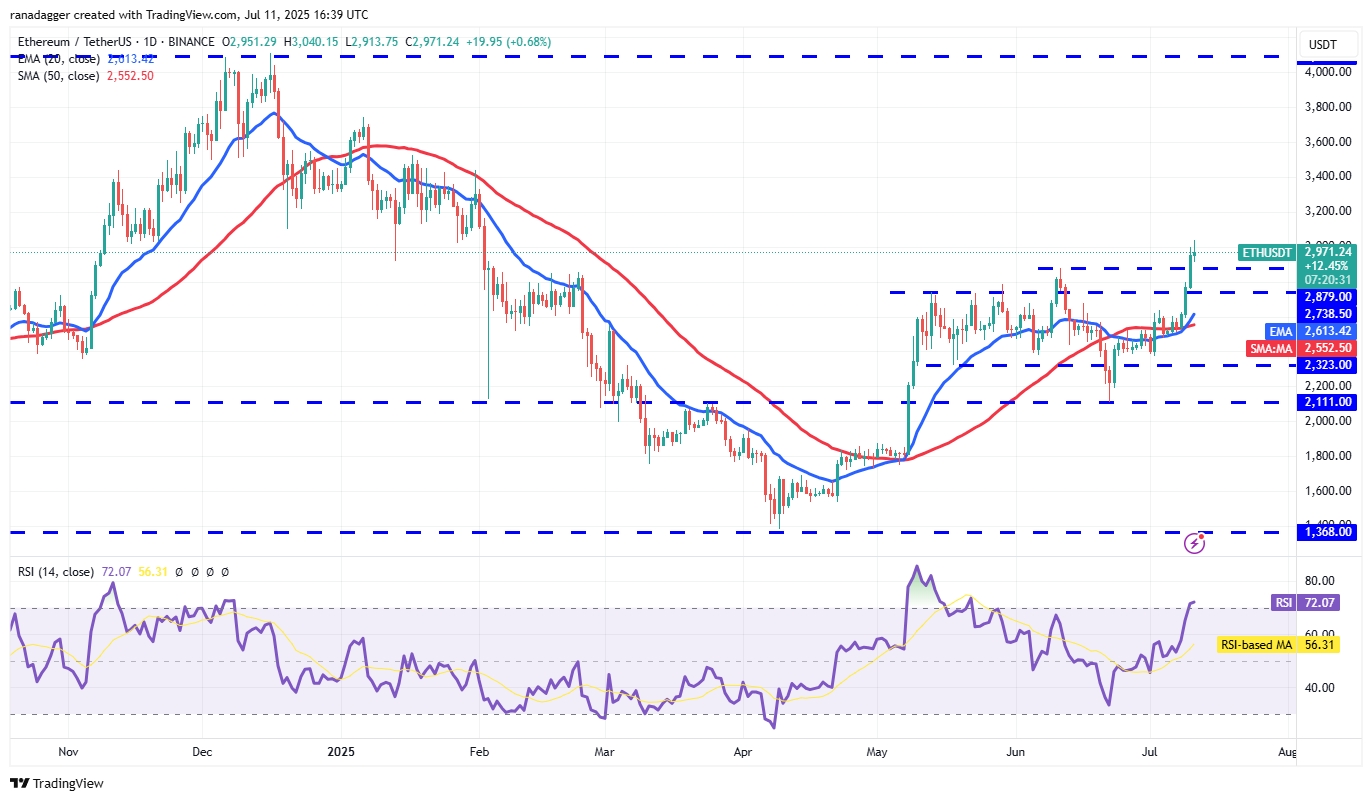
ETH/USDT daily chart. Source: Cointelegraph/TradingView
The 20-day EMA has turned up, and the RSI is in the overbought zone, indicating that bulls have the upper hand. There is minor resistance at $3,153, but if the level is crossed, the ETH/USDT pair could ascend to $3,400 and subsequently to $3,750.
The first support on the downside is at $2,879 and then at $2,733. Sellers will have to pull the price below $2,733 to trap the aggressive bulls. Until then, every minor dip is likely to be viewed as a buying opportunity.
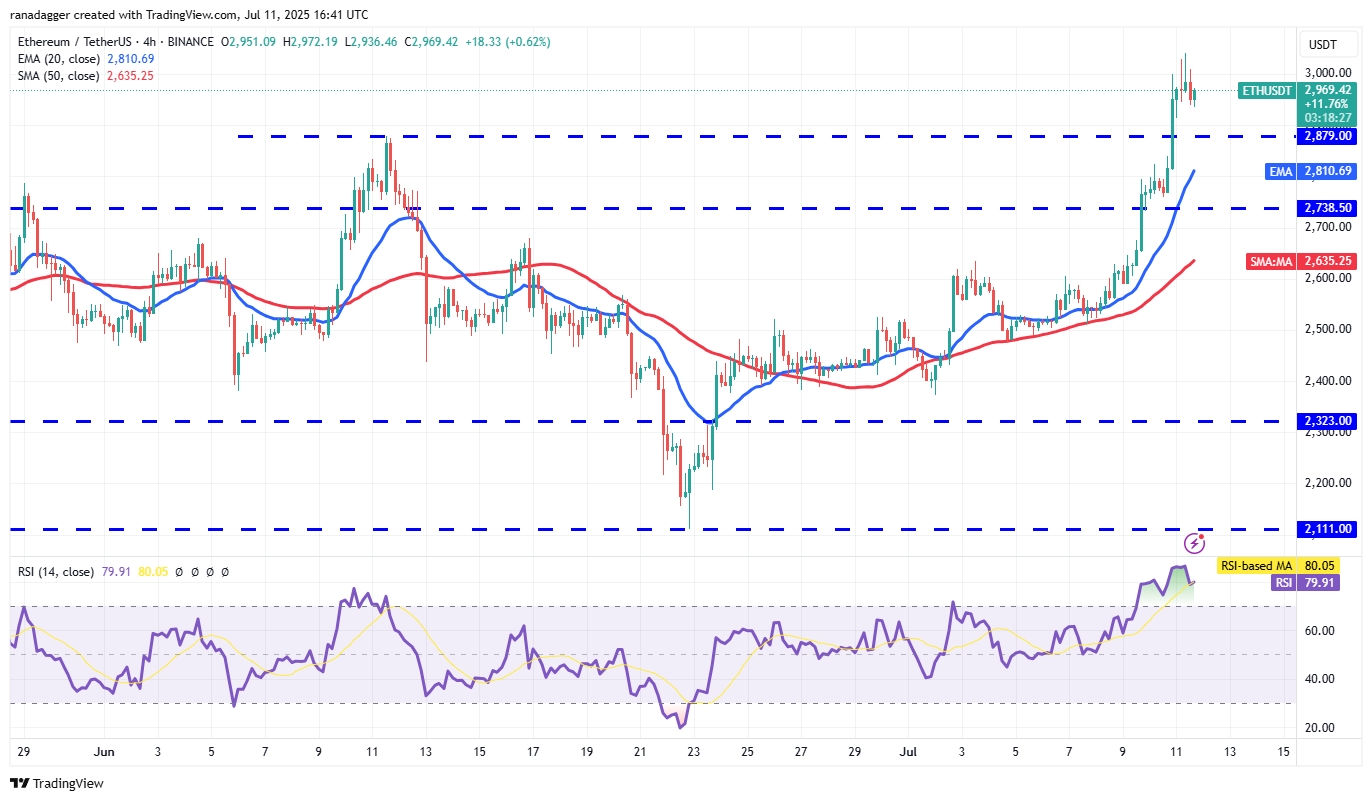
ETH/USDT 4-hour chart. Source: Cointelegraph/TradingView
The RSI on the 4-hour chart has jumped into the overbought zone, suggesting a short-term consolidation or correction. The pair could pull back to $2,879, where the buyers are expected to step in. If the price bounces off $2,879 with force, it indicates that the bulls are trying to flip the level into support. That improves the prospects of the continuation of the uptrend.
Short-term buyers may book profits if the price tumbles below $2,879. The pair may then descend to the 20-EMA.

#Join HTX 12th Anniversary Quiz Challenge#Miss HTX Season 3 Kicks Off With Global Selection#Claim1,200 USDT in the Monthly Creation Challenge#Do you think NEWT is promising?#Do you think SPK is promising?
3Поделиться
Все комментарии0НовыеВ тренде
Нет записей