

Crypto Express
07/10 01:21
ADA Rally signal confirmed?
From a technical lens, the story is at a crossroads.
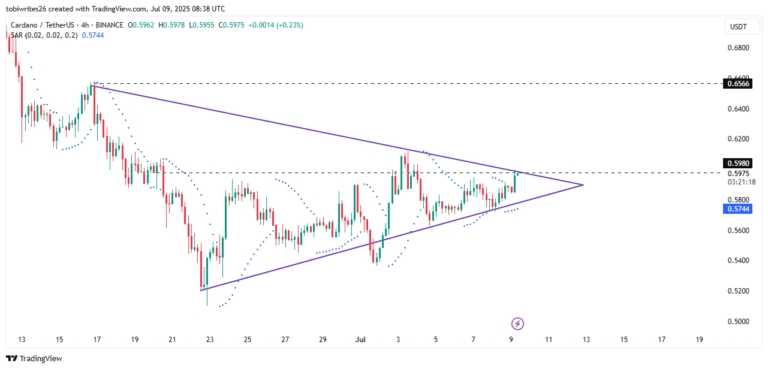
At press time, ADA was forming a symmetrical triangle, a pattern typically seen before high-volatility moves. The price has tested both support and resistance levels within this formation but hasn’t broken out yet.
Notably, ADA traded at $0.5975, just shy of the triangle’s upper bound and the next major resistance at $0.6566.
The Parabolic SAR, a trend-following indicator, also painted a bullish picture, with the dotted lines now forming beneath the price – a signal often tied to upward movement.
Having said that, the breakout remains unconfirmed until ADA decisively closes above the pattern’s top line.
#Check In Weekly, Win Prizes Weekly — Join the Fun!#Share Your Thoughts on Popular Assets in June#Claim1,200 USDT in the Monthly Creation Challenge
82Share
All Comments0LatestHot
No records