

crypto analysis
07/08 23:49
Amp crypto price prediction
Amp crypto price prediction
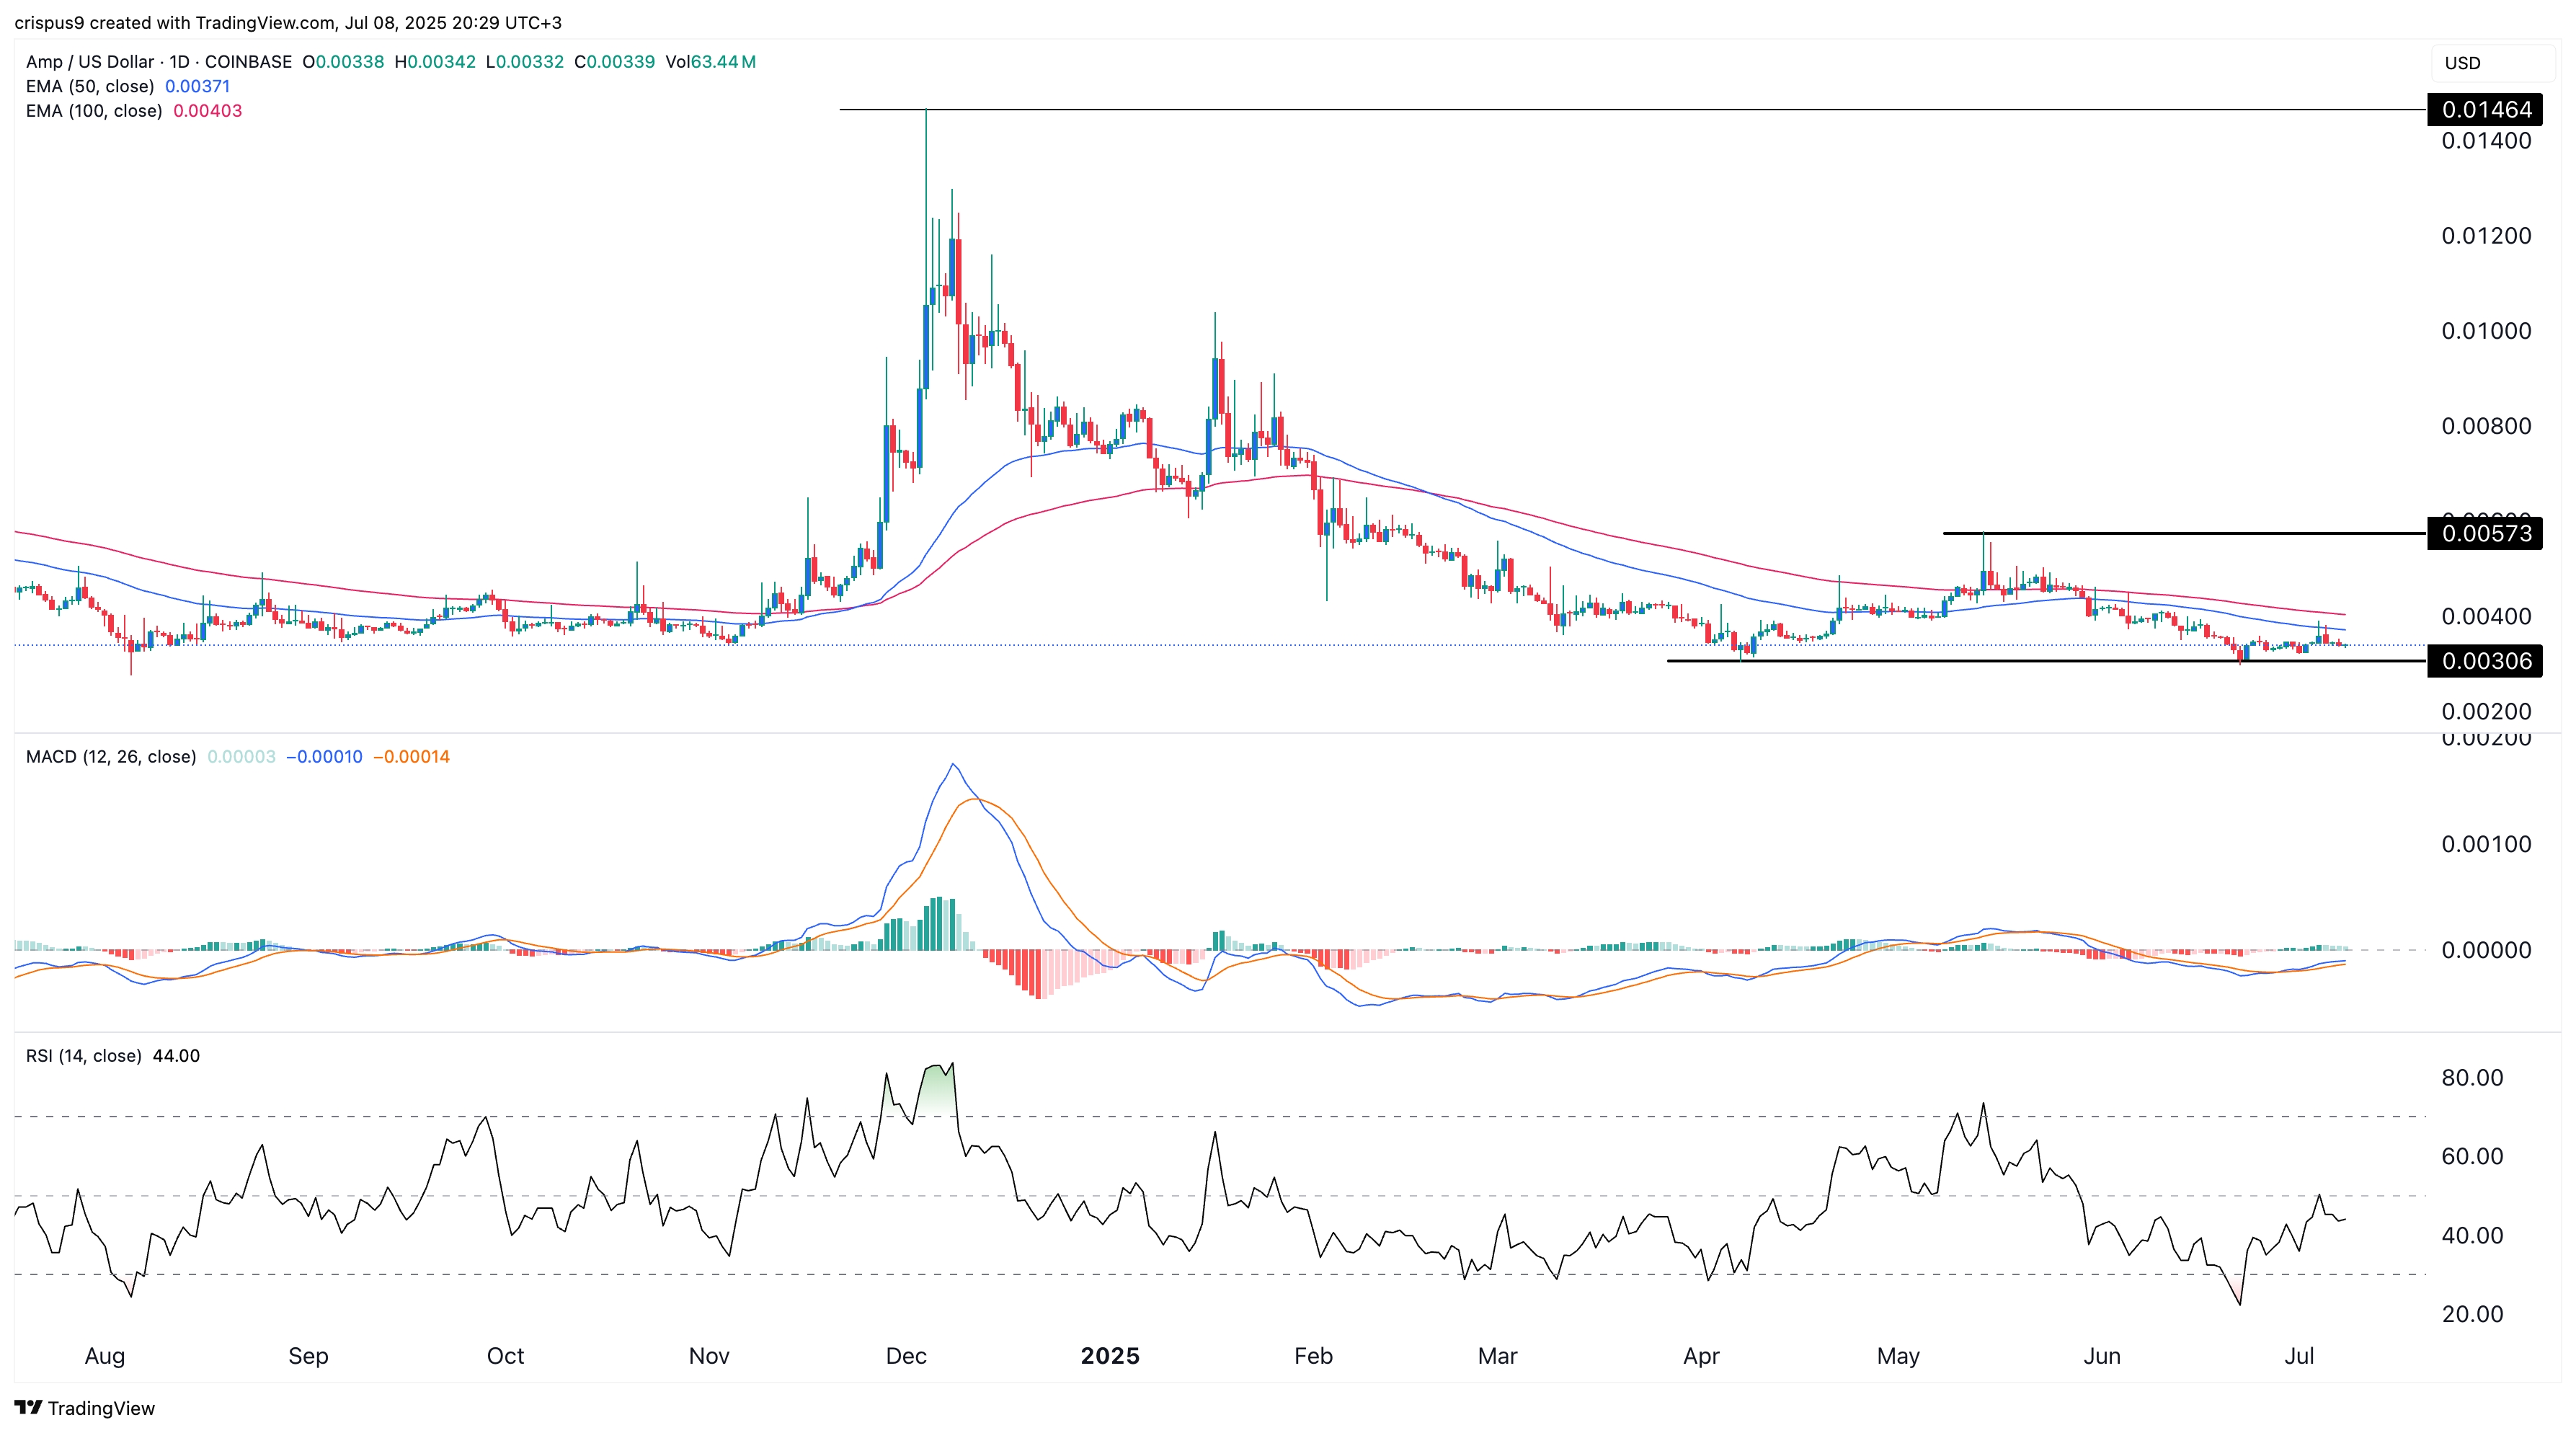
The daily chart shows that Amp has formed a double-bottom pattern at $0.00306, a bullish setup in technical analysis.
Meanwhile, the Relative Strength Index has rebounded from an oversold reading of 28 in June to the current 44. The Moving Average Convergence Divergence indicator has also flashed a bullish crossover.
These indicators suggest a potential bullish reversal. If momentum continues, the next target could be $0.00573, the swing high from May 14, which would represent a gain of about 70% from current levels. However, a drop below the support at $0.0030 would invalidate the bullish thesis.
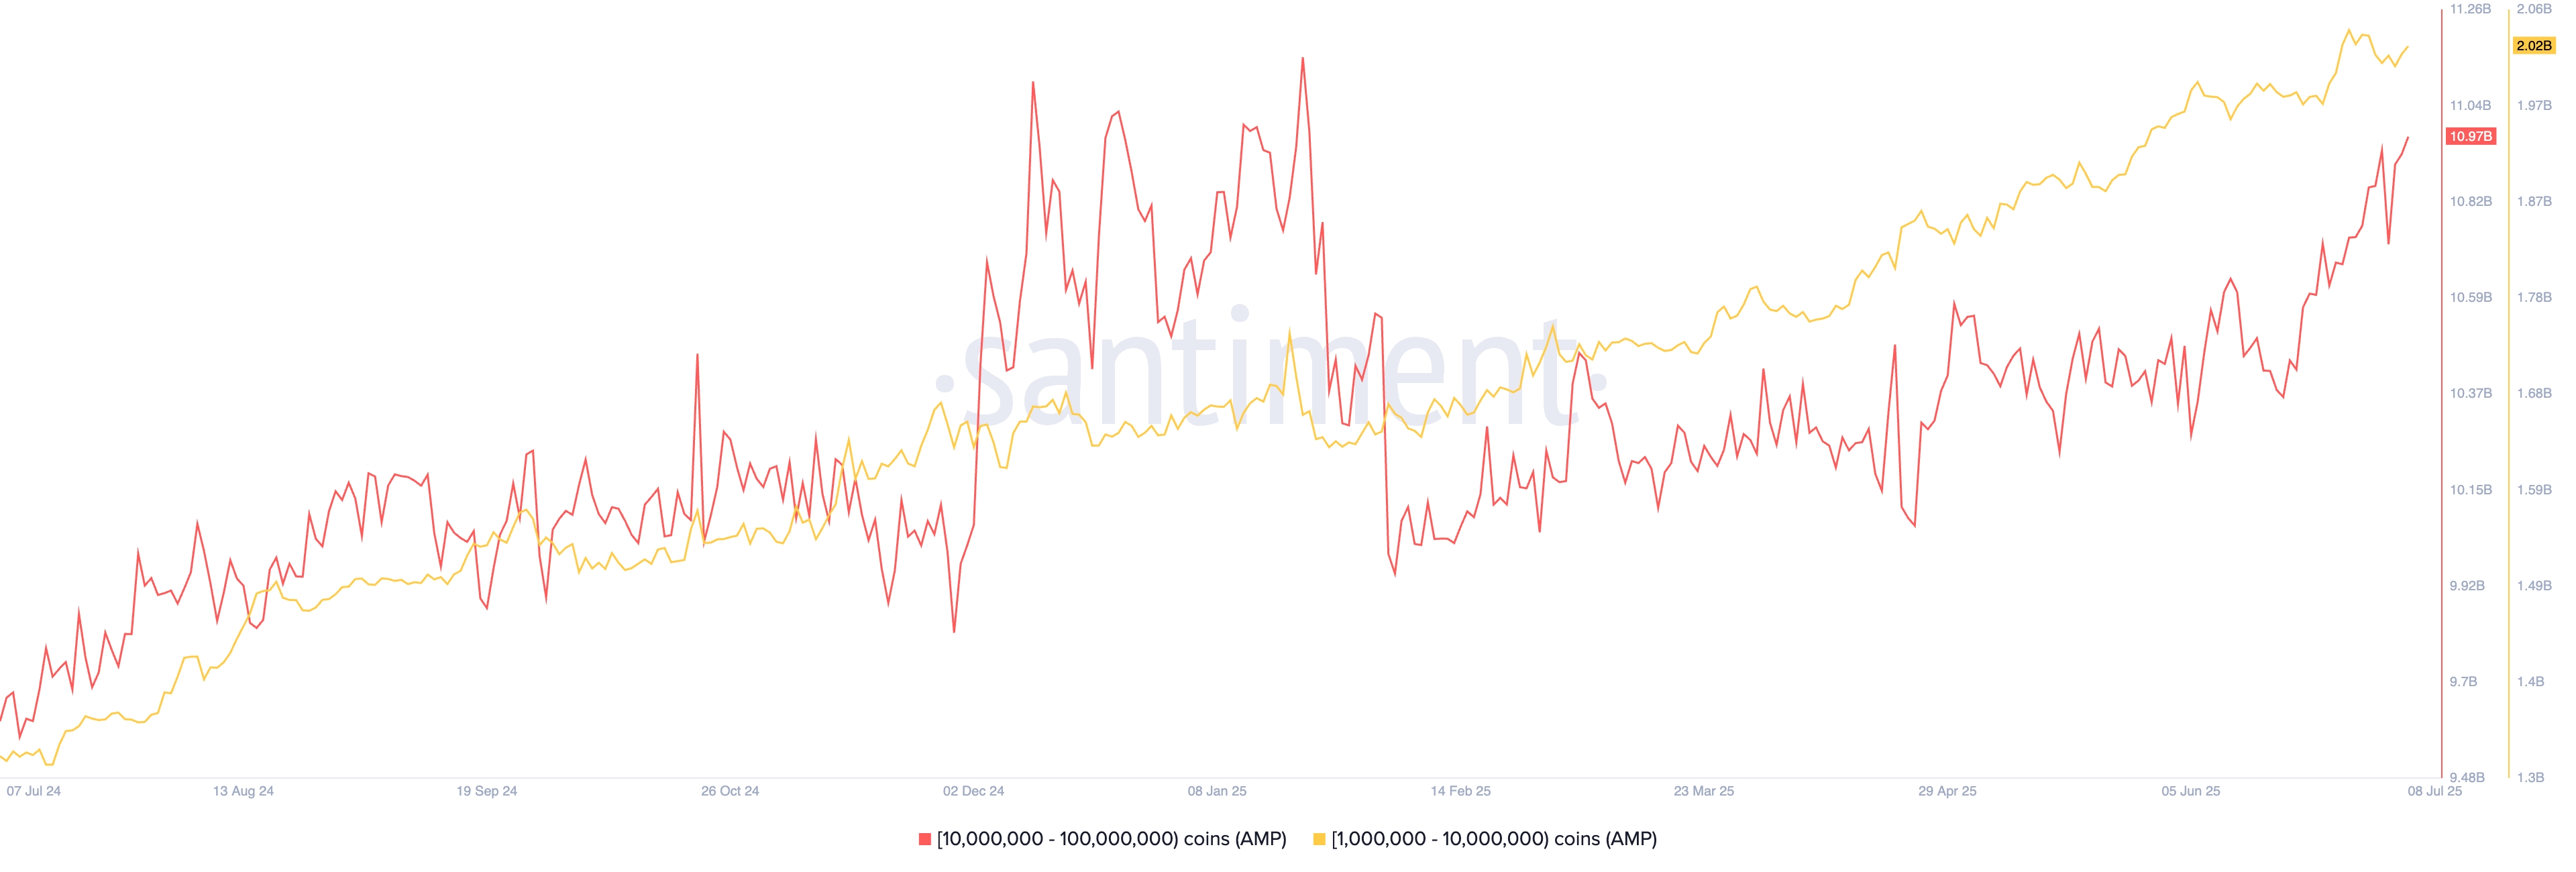
On the positive side, on-chain data suggests that whales are still accumulating Amp tokens, potentially betting on a rebound. Addresses holding between 10 million and 100 million AMP now control 10.97 billion tokens, up from 9.95 billion in February, according to Santiment.
Additional data from Nansen shows that the supply of AMP tokens on exchanges has dropped by over 43% in the past 90 days. This is typically seen as a bullish sign, indicating that investors are transferring tokens to private wallets rather than preparing to sell.
#Check In Daily, Win Prizes Daily — Join the Fun!#Join HTX On A Fitness Journey To Mars#Claim1,200 USDT in the Monthly Creation Challenge
36シェア
すべてのコメント0Latestホットリスト
記録なし