Bitsky
06/30 04:52
The Daily Chart :- BTC continues to face challe
The Daily Chart :-
BTC continues to face challenges in surpassing the key $111K resistance level, its current all-time high, after several weeks of consolidation. Despite multiple attempts, intensified selling pressure and profit-taking at this level have repeatedly halted bullish momentum, resulting in sideways price action.
Recently, the cryptocurrency dipped below the $100K support zone, triggering a liquidity sweep and collecting the fuel for a potential new leg up.
However, the subsequent rebound has stalled around the $107K mark, signaling weakening bullish strength. If demand returns and buying pressure increases, a breakout above the $111K ATH could materialize. Otherwise, another rejection is likely, pushing the price back toward the critical $100K support in the coming sessions.
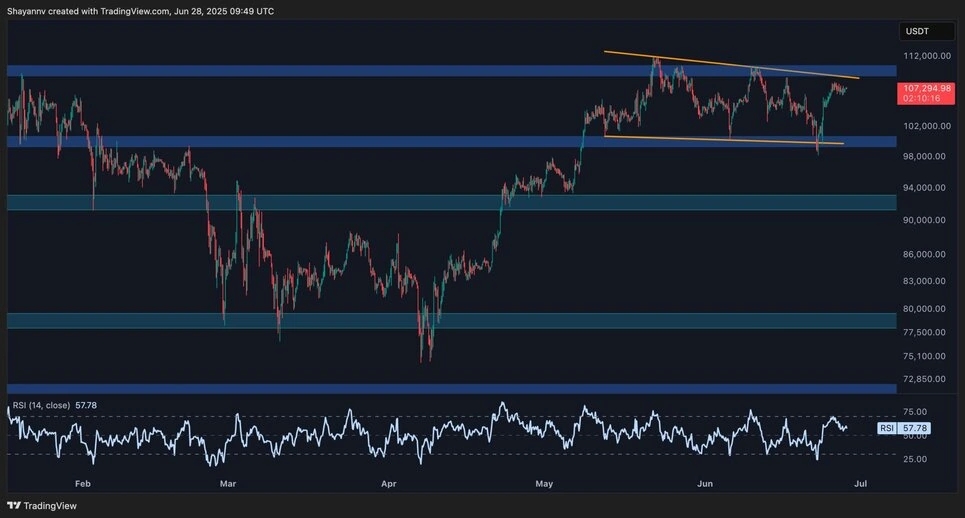
The 4-Hour Chart :-
On the lower timeframe, Bitcoin has been forming a bullish flag just below its all-time high, a pattern typically signaling continuation of the existing uptrend.
Following a liquidity grab beneath the lower boundary of the flag near $100K, Bitcoin rallied toward the upper boundary at $107K. Despite this upward move, the price has entered a low-volatility phase, indicating a loss of momentum as it approaches resistance.
Should a breakout occur early next week, a new all-time high is likely. Conversely, failure to hold above the current level could trigger another drop, sending the price back toward the lower end of the flag. Until then, price action remains confined, with both bulls and bears waiting for confirmation of the next directional move.
#Share Your Thoughts on Popular Assets in June#Check In to Win a 20g Gold Bar#Claim1,200 USDT in the Monthly Creation Challenge# Israel’s attack on Iran.#US May CPI data
5Поділитися
Усі коментарі0НовіПопулярно