Mr Arham
06/24 15:52
As for Shiba Inu, the daily chart shows that pri
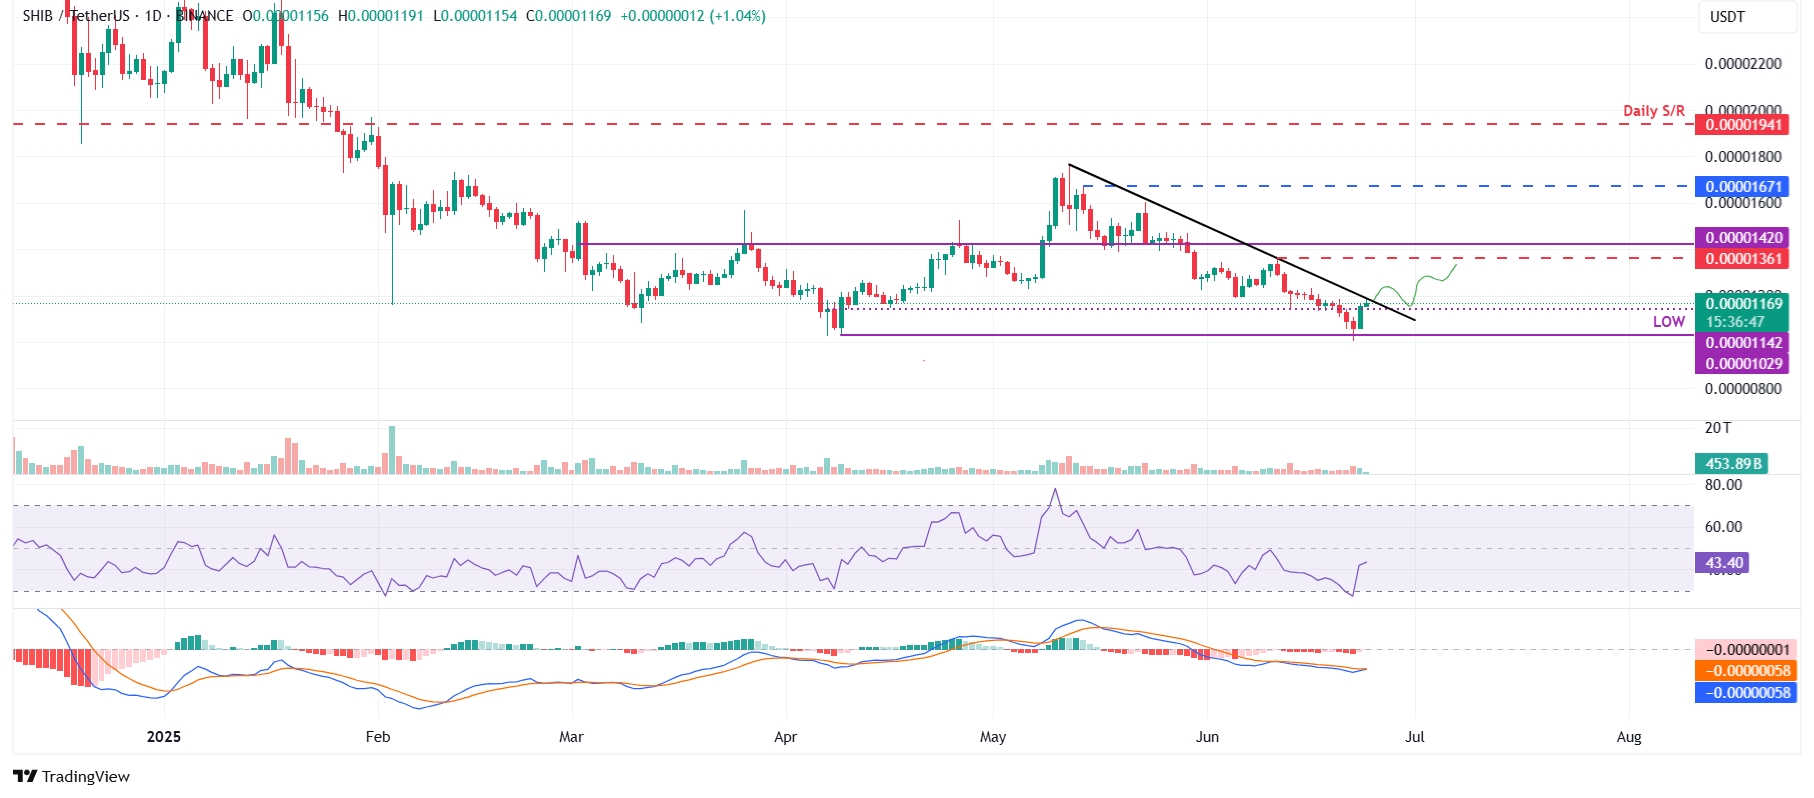
As for Shiba Inu, the daily chart shows that prices declined and retested the April 9 low at $0.000010 on Sunday and recovered by 9.15% the next day, closing above the daily resistance at $0.000011. At the time of writing on Tuesday, it continues to recover, approaching a descending trendline drawn by connecting multiple high levels since mid-May.
If SHIB breaks and closes above the descending trendline, the next resistance could be found at the June 11 high of $0.000013.
Similar to DOGE, the RSI on the daily chart of SHIB reads 43, indicating a V-shaped recovery after retesting its oversold conditions on Sunday. The MACD is also flipping a bullish crossover on the daily chart.
If SHIB closes below the daily support at $0.000011 on a daily basis, it could extend the decline toward its April 9 low at $0.000010.
#Share Your Thoughts on Popular Assets in June#Miss HTX Season 3 Kicks Off With Global Selection#Join HTX On A Fitness Journey To Mars#Do you think BULLA is promising?#Do you think LISTA is promising?
1分享
全部評論0最新熱門