B4Bit
06/22 13:05
Dogecoin Price Analysis
Dogecoin Price Analysis
On the daily chart, Dogecoin’s price action shows a base forming near the $0.17 support zone. Notably, Dogecoin has previously rebounded from this level in April, May, and June.
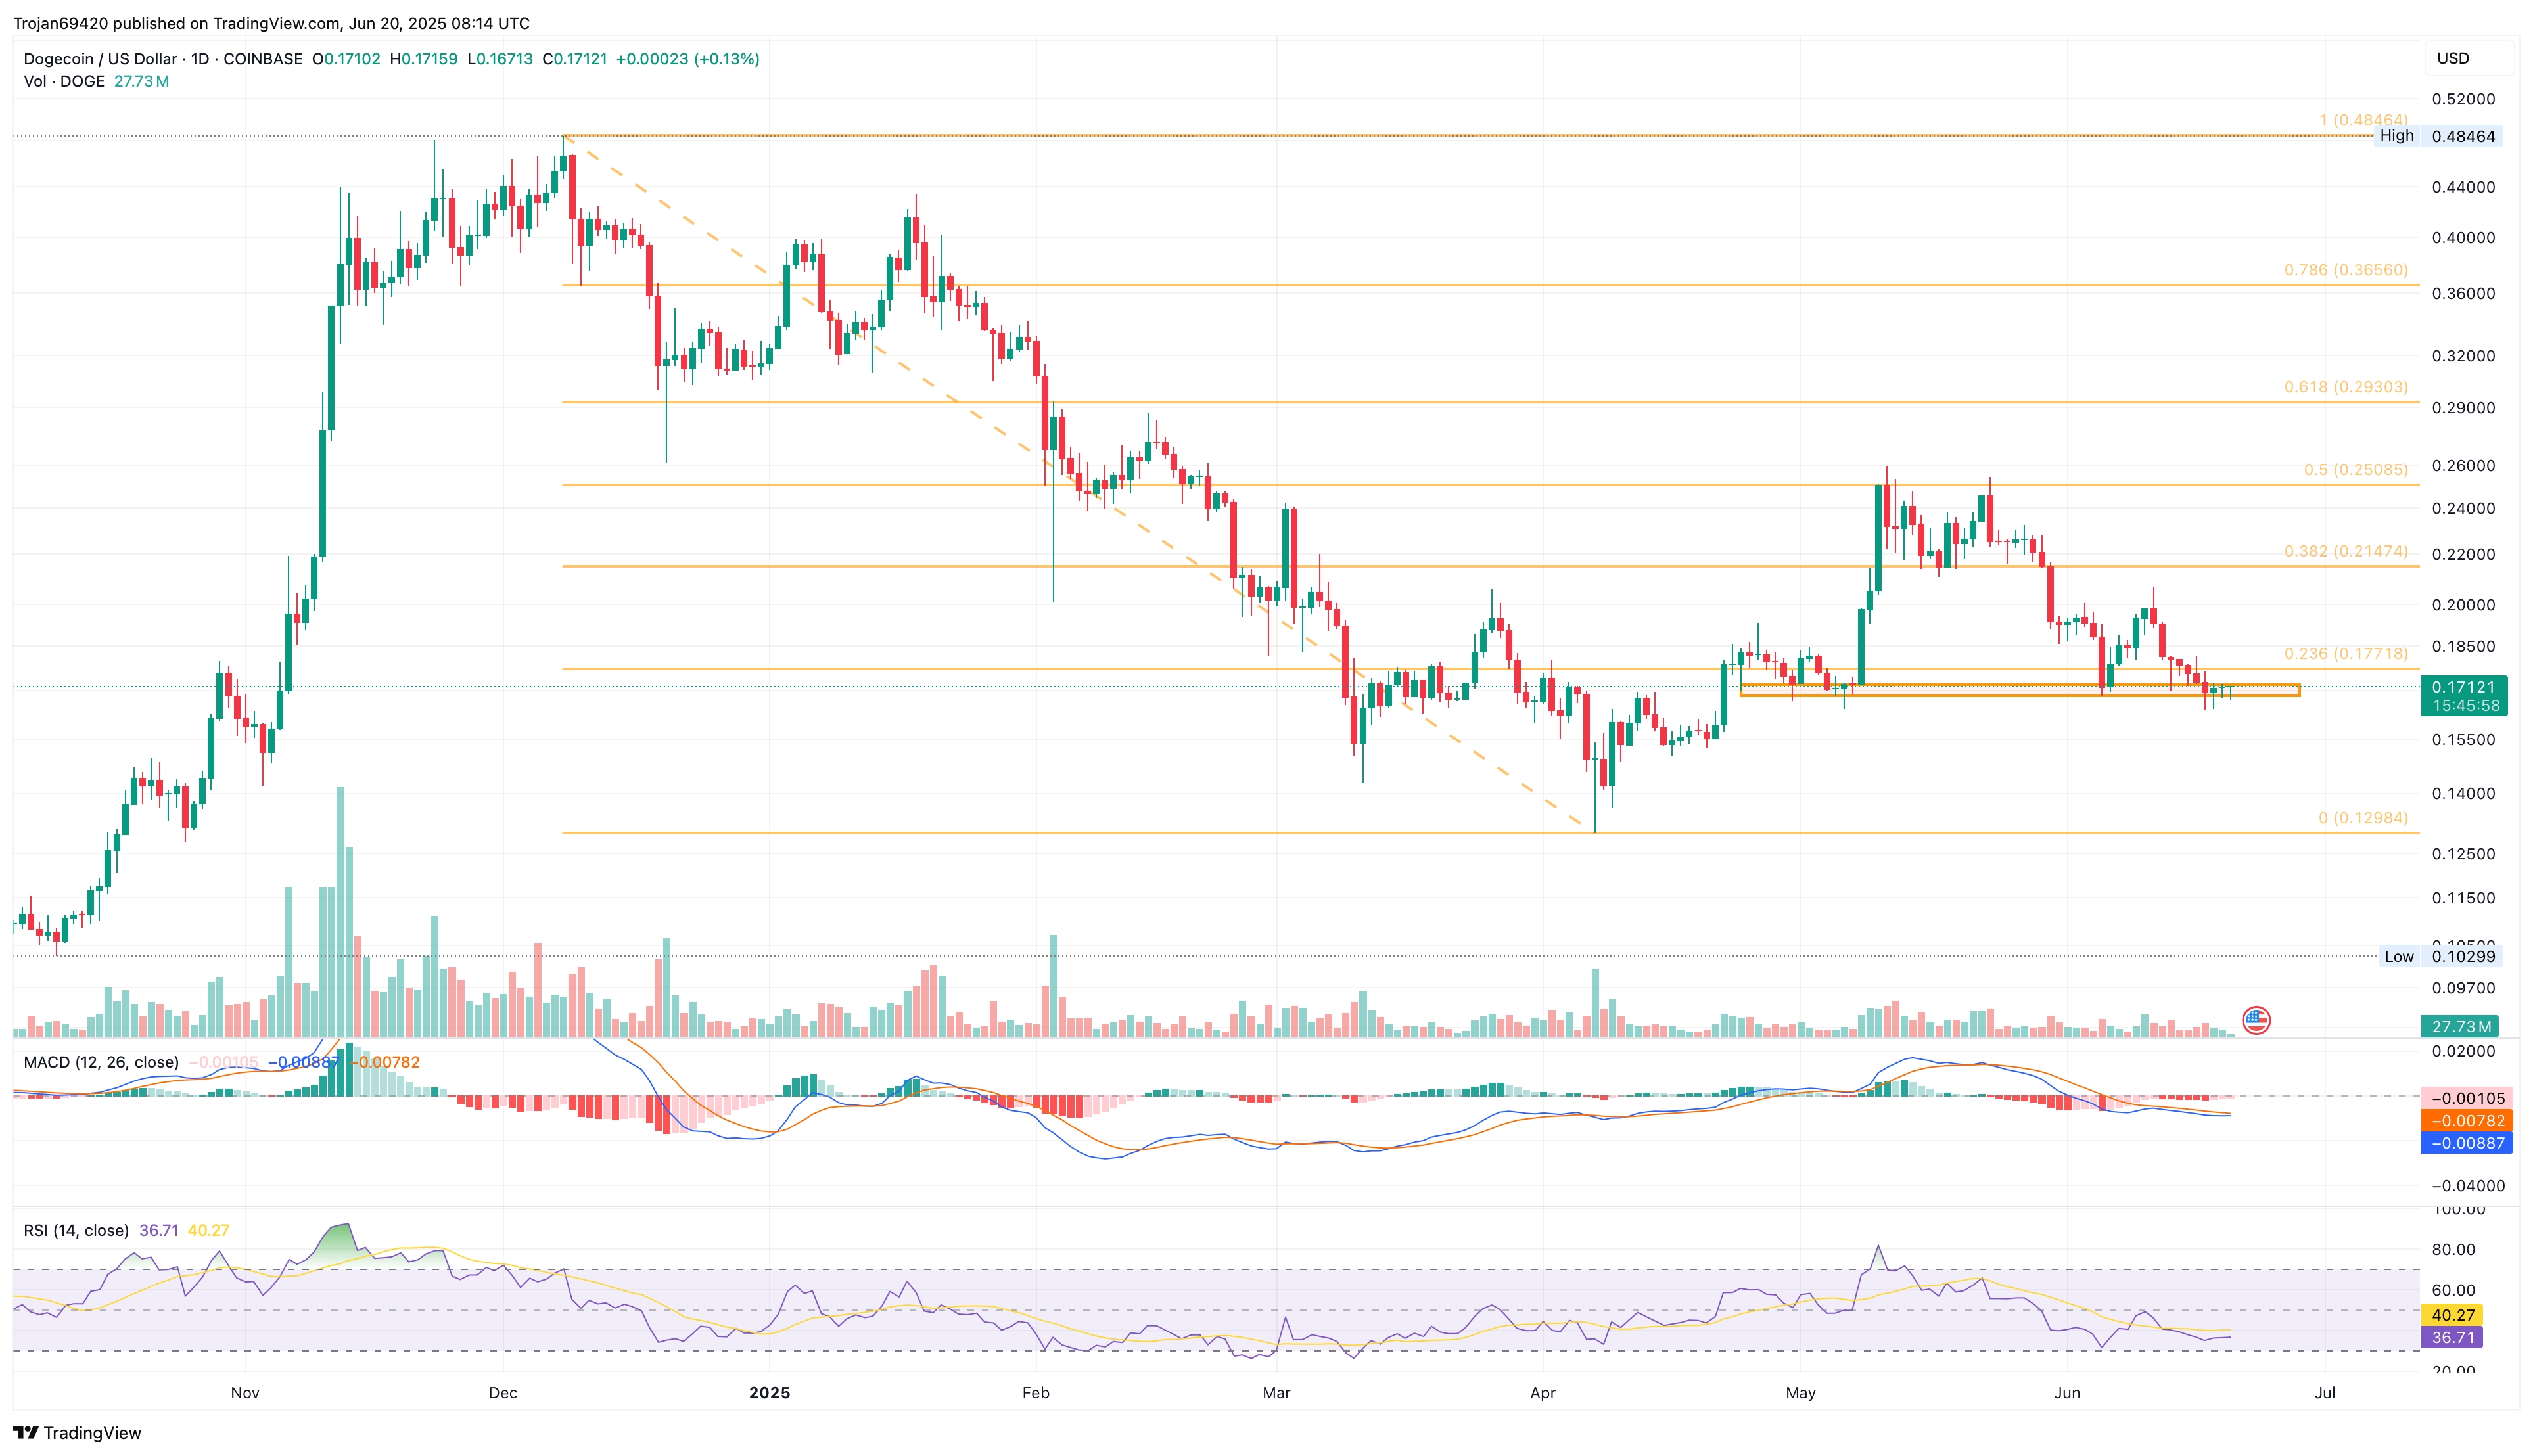
Following a recent bounce from a weekly low of $0.1639 to $0.1711, Dogecoin shows signs of an extended recovery.
The MACD and signal lines are nearing a bullish crossover, while the daily RSI has risen after reversing from the oversold zone. This suggests a short-term uptick in bullish sentiment, supporting the potential for a price rebound.
According to Fibonacci retracement levels, a daily close above the 23.60% mark could push Dogecoin toward the psychological resistance at $0.20. Conversely, a close below the current support zone could open the door to a decline toward $0.15.
全部評論0最新熱門