

BTC31011
06/16 01:06
Bitcoin Technical Setup and Price Structure On th
Bitcoin Technical Setup and Price Structure
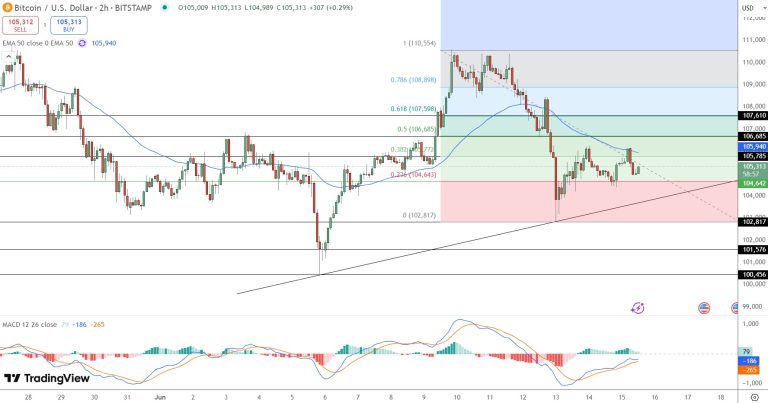
On the 2-hour chart, Bitcoin has formed a rising trendline off early-June lows near $102,817, printing higher lows that suggest durable support. Trading between the 23.6% Fib retracement at $104,643 and 38.2% Fib at $105,772, BTC finds itself sandwiched under the 50‑EMA at $105,940. A Doji candle near the lower boundary signals market indecision.
Momentum indicators add nuance: the MACD line is converging with its signal, and the histogram is shrinking from negative territory—both signs of cautious bullish sentiment. Absence of bearish patterns like “Three Black Crows” and presence of a spinning top candle point to consolidation rather than capitulation.
Risk Zones and Bitcoin Trade Strategy
Here’s a potential Bitcoin price prediction you can follow:
- Bullish Entry: Watch for a breakout above $105,772 and the 50‑EMA.
- Stop‑loss: Place it below today’s swing low near $104,500.
- Targets:
- $106,685 (50% Fib)
- $107,598 (61.8% Fib)
Alternatively:
- Bearish Strategy: If Bitcoin drops below $104,600 (trendline + 23.6% Fib), it could revisit $102,817 support
Все комментарии0НовыеВ тренде
Нет записей