

bit999
06/15 11:09
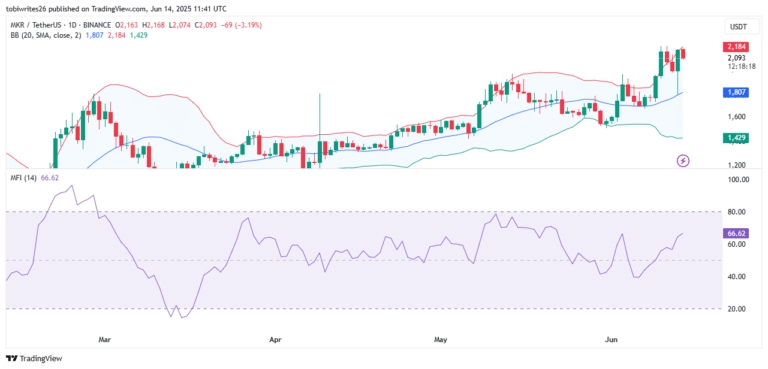
Bollinger Bands and MFI point to rebound potential
Historically, moves into this region have led to price pullbacks—either toward the middle band (blue) or the lower support band (green).
Both of these levels typically provide strong support, allowing the price to rebound and potentially form higher highs.
#Check In Daily, Win Prizes Daily — Join the Fun!#Share Your Thoughts on Popular Assets in June#Claim1,200 USDT in the Monthly Creation Challenge
2分享
全部評論0最新熱門
暫無記錄