

Bit360
06/15 10:46
Dogecoin Price Analysis
Dogecoin Price Analysis
On the daily chart, Dogecoin’s price action reveals a bullish failure to maintain the uptrend seen earlier this week. After facing strong rejection at the 100-day EMA of $0.2043, the meme coin has taken a bearish turn, with a third consecutive red candle forming.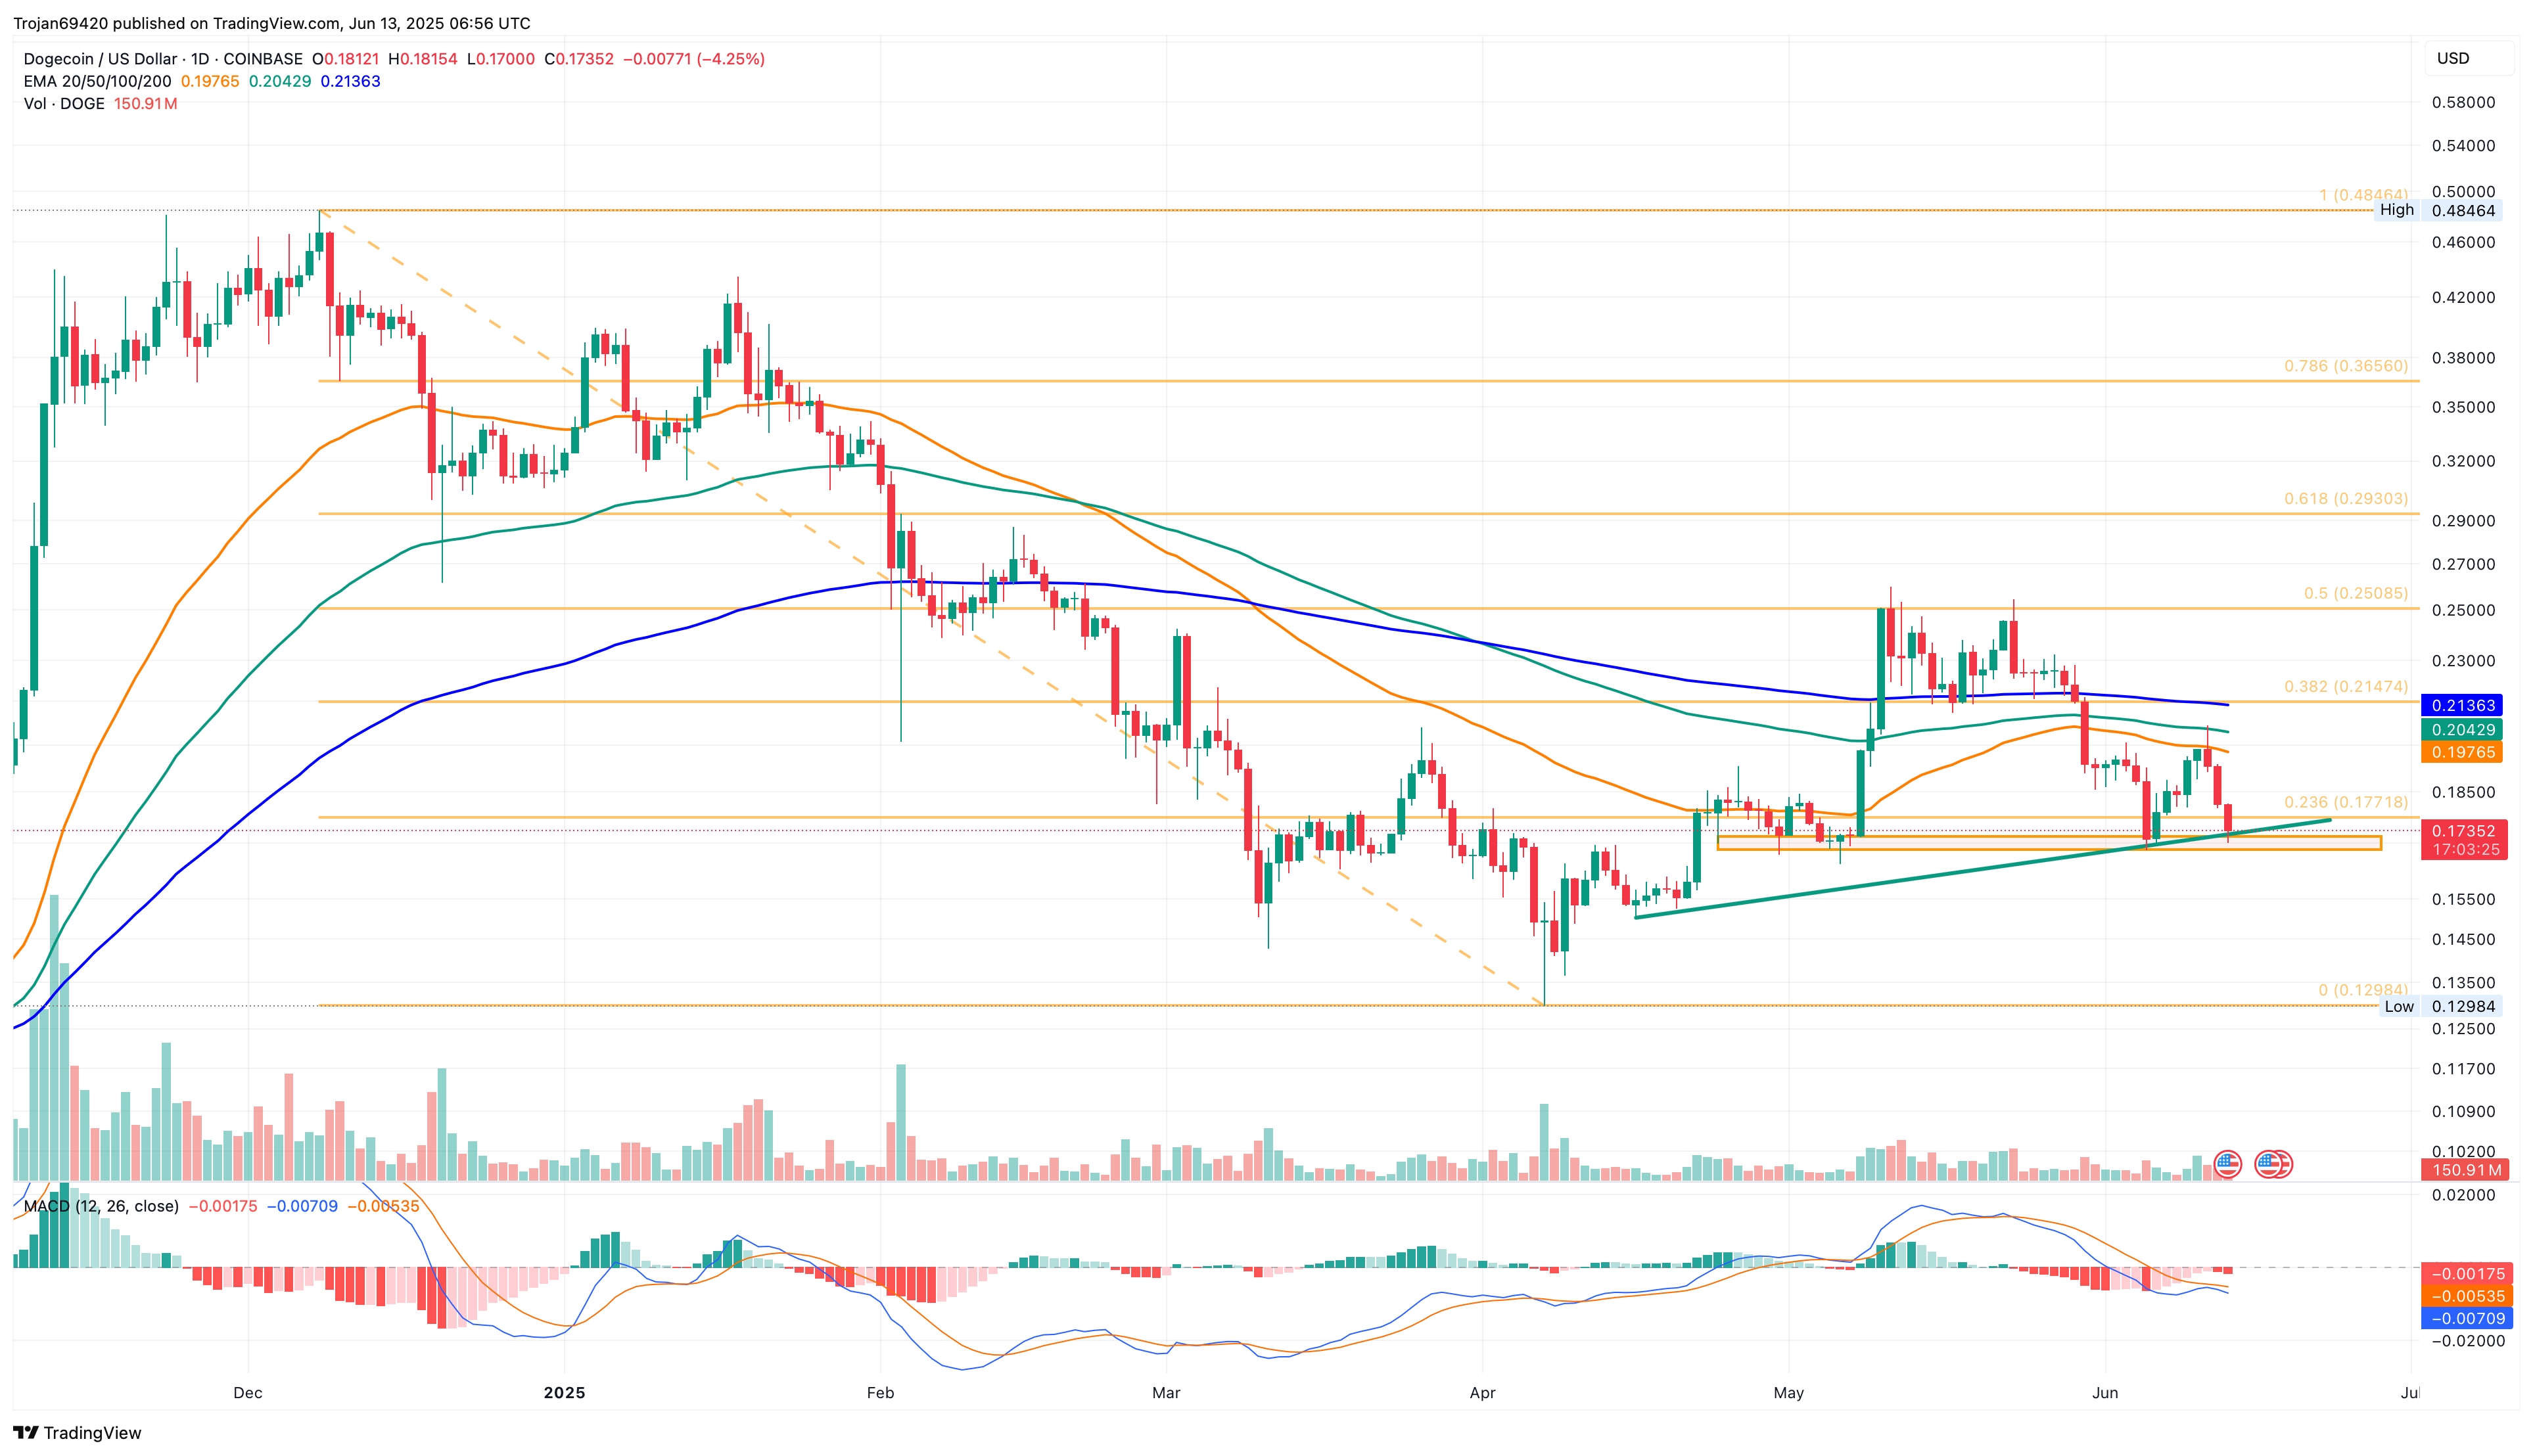
Dogecoin is now trading below the 23.60% Fibonacci retracement level at $0.17718. Its current market price is $0.1740, reflecting a 3.95% drop on the day.
As the pullback intensifies, pressure is building on the local support trendline and the $0.17 demand zone. While optimistic traders are looking for a potential double-bottom reversal at $0.17, the broader market sentiment increases the risk of a breakdown.
The MACD and signal lines have failed to form a bullish crossover and continue to trend downward, with a rising number of bearish histogram bars. Additionally, the continued decline in the 50-, 100-, and 200-day EMAs reinforces the bearish outlook.
According to Fibonacci levels, a deeper pullback to $0.1298 is possible. However, price action analysis suggests minor support at $0.1529. On the flip side, a potential reversal could target the 50-day EMA at $0.1976.
Todos los comentarios0Lo más recientePopular
No hay registros