

SilentEyes
06/13 17:17
A 10% drop on the horizon — Here’s why The 1-day
A 10% drop on the horizon — Here’s why
The 1-day chart shows that RAY has broken below an ascending channel and is trending downward.
Typically, a breakdown from this pattern leads the price to retrace to the beginning of the channel—suggesting a potential 10% drop from current levels.
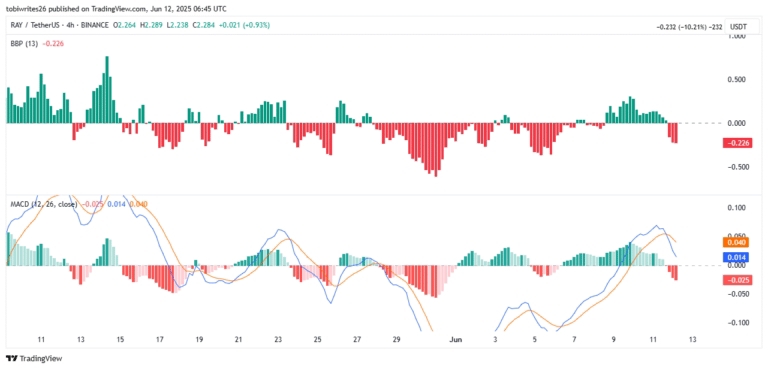
Technical indicators support this outlook. The Bull-Bear Power indicator revealed strong bearish momentum, reflected in the formation of red histogram bars.
Similarly, the Moving Average Convergence Divergence (MACD) indicator confirmed a bearish crossover — also known as a Death Cross — marking the beginning of a new downward phase.
If these metrics continue to decline, Raydium could face further losses—especially if spot traders halt their accumulation efforts.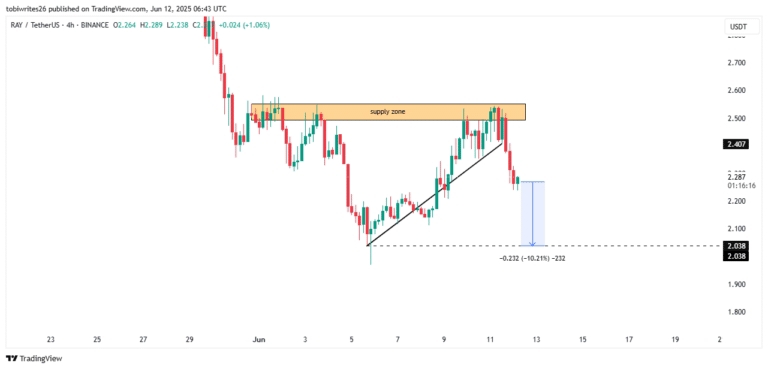
#Check In Daily, Win Prizes Daily — Join the Fun!#Share Your Thoughts on Popular Assets in June#Claim1,200 USDT in the Monthly Creation Challenge
1공유
모든 코멘트0최신인기
기록 없음