

B3bit
06/13 15:07
Bitcoin Technical Analysis
Bitcoin Technical Analysis
There were plenty of uncertainties when gauging the potential top for BTC, and what events could shape its run in the coming months.
With tariffs, even predictions in the short term were extremely tricky.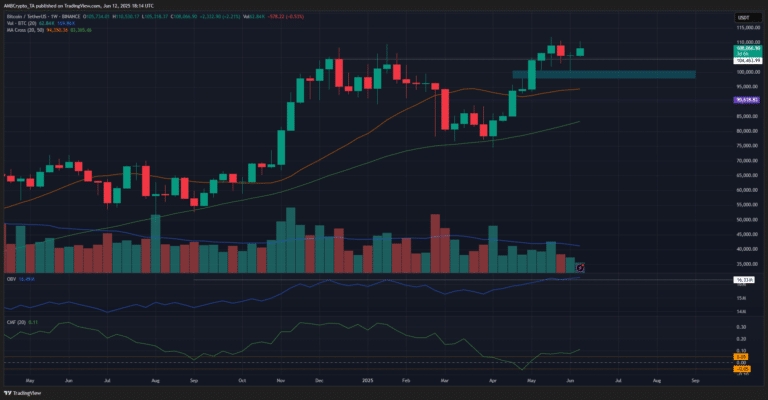
Technical analysis showed that the long-term prospects of Bitcoin were bullish. On the weekly chart, the price was above the 20 and 50-week moving averages.
That alone kept long-term momentum intact.
Its OBV moved past the December 2025 high, signaling steady buying volume after the retracement in March and April. The CMF agreed and climbed above the +0.05 mark to indicate heavy capital inflows.
The price action showed a bullish structure, with the price making a new high past the previous weekly close high at $104.4k. This was a sign that the swing structure was bullish.
The fair value gap (cyan) at $98k-$100.7k was a key demand zone that was tested earlier in June.
全部評論0最新熱門
暫無記錄