

Bit360
06/12 08:05
Uniswap is back on track for recovery
Uniswap is back on track for recovery after the decisive breakout 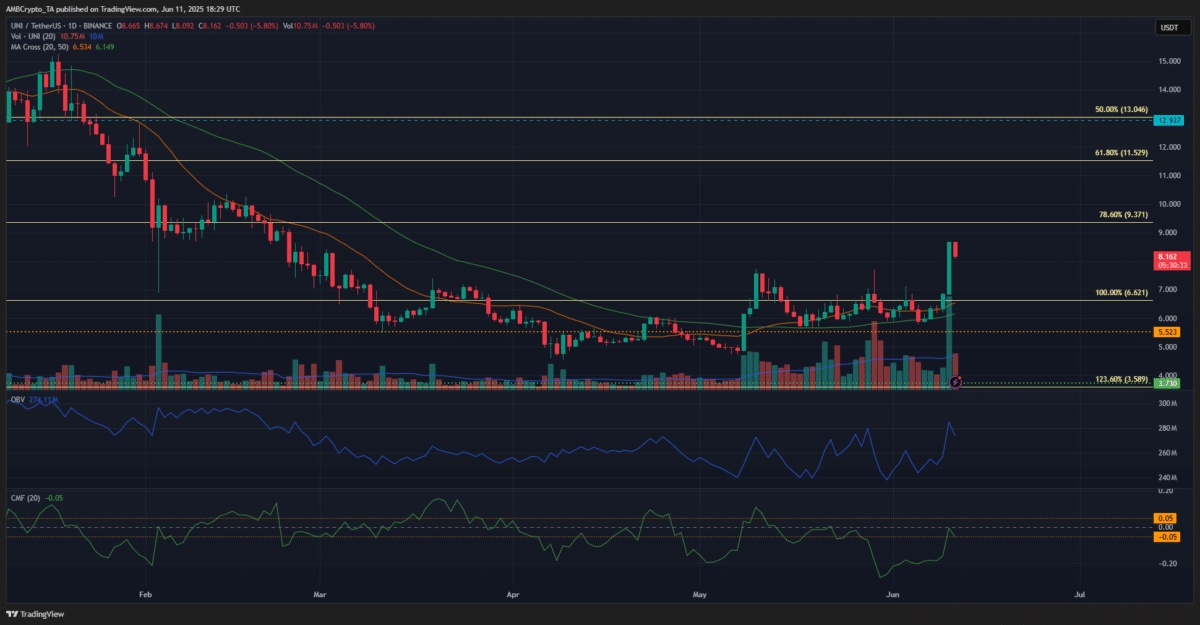
The 1-day chart revealed a bullish breakout beyond the local resistance levels at $6.62 and $7.55. The breach of the latter level highlighted bullish intent, with the price action structure already in favor of the bulls after the rally to $7.55 in early May.
The OBV has been volatile over the past six weeks, but the recent rally saw the volume indicator make a new high. While this underlined strong demand, the CMF showed the opposite. With a reading of -0.05, it reflected capital outflows since the early May rally.
The CMF takes into account the money flow over 20 days, while the OBV is the cumulative sum of the daily trading volumes, which explains the difference.
For traders trying to make their decision, the CMF presented a warning signal. However, the UNI push beyond $7.55 may be the deciding factor. Moreover, the moving averages signaled bullish momentum.
Over the past month, the 50 DMA has acted as a reliable support level. Hence, traders and investors can flip their bias bearishly only if this dynamic support is lost and anticipate the rally to continue.
All Comments0LatestHot
No records