Crypto Express
06/11 08:54
WIF heading for a bearish reversal soon?
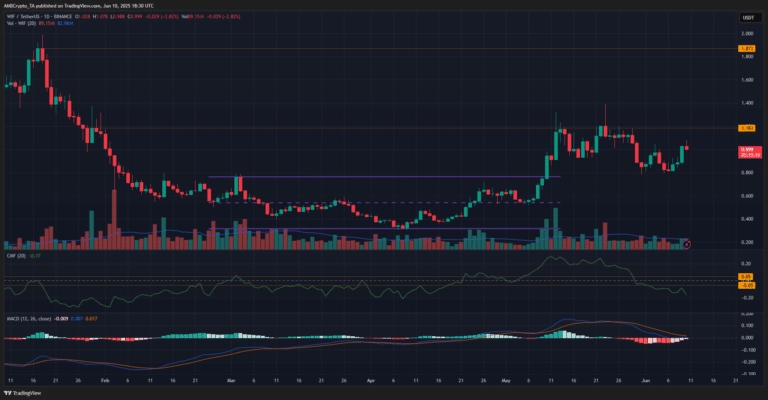
The 1-day chart signaled a bearish structure for dogwifhat. After testing the $1.18 resistance in mid-May, WIF set a higher low at $0.93 four days later, before bouncing higher to test $1.18 once again.
The second attempt was met with failure, and the rejection forced the price below the $0.93-mark. This shifted the structure bearishly on 31 March. A few hours before the time of writing, WIF attempted to rally beyond $1, but could not succeed.The CMF on the daily chart was at -0.17, signaling heavy capital outflows. The MACD was near the zero line and on the verge of forming a bearish crossover.The 4-hour chart revealed a CMF at +0.06, following the price bounce from the local low at $0.8. The brief move beyond $1.04 suggested a structure shift, but it was more likely to be followed by a reversal.
We had a brief dogwifhat price peek above the $1.04-level, followed by a bearish engulfing candle on the H4 chart – A sign of a bearish reversal. The CMF’s drop below +0.05 would be a clue that buying pressure has waned.The bearish crossover on the MACD could also confirm the momentum shift. As things stand, a sustained WIF rally might need Bitcoin [BTC] to jump higher. Until then, traders can expect a reversal towards $0.8.
#Post To Earn Bonus#Share Your Thoughts on Popular Assets in June#Claim1,200 USDT in the Monthly Creation Challenge
26分享
全部評論0最新熱門