

BTC31011
06/11 00:44
Key Resistance Ahead: Can $AAVE Push Beyond $350?
Key Resistance Ahead: Can $AAVE Push Beyond $350?
The $AAVE/$USDT daily chart reveals a breakout from an ascending channel, a bullish pattern.
Yet caution may be warranted. With the RSI hovering at 71.53, the token sits in overbought territory, potentially priming the market for a short-term cooldown.
The next major resistance appears between $350.47 and $364.68—an area that has historically acted as a strong selling zone. If bullish momentum persists, technical analysis suggests an 18.3% upside potential toward this resistance range.
However, traders should note emerging bearish divergence on the RSI, where the indicator has formed lower highs while prices made higher highs. This discrepancy could indicate weakening upward momentum.
If the breakout fails, support lies around $250, which is both a psychological level and a previous demand zone.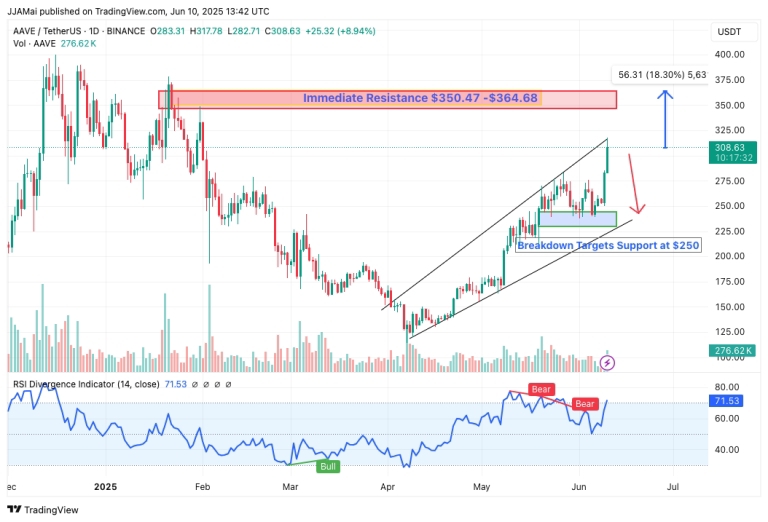
全部评论0最新最热
暂无记录