

Crypto Express
06/09 00:11
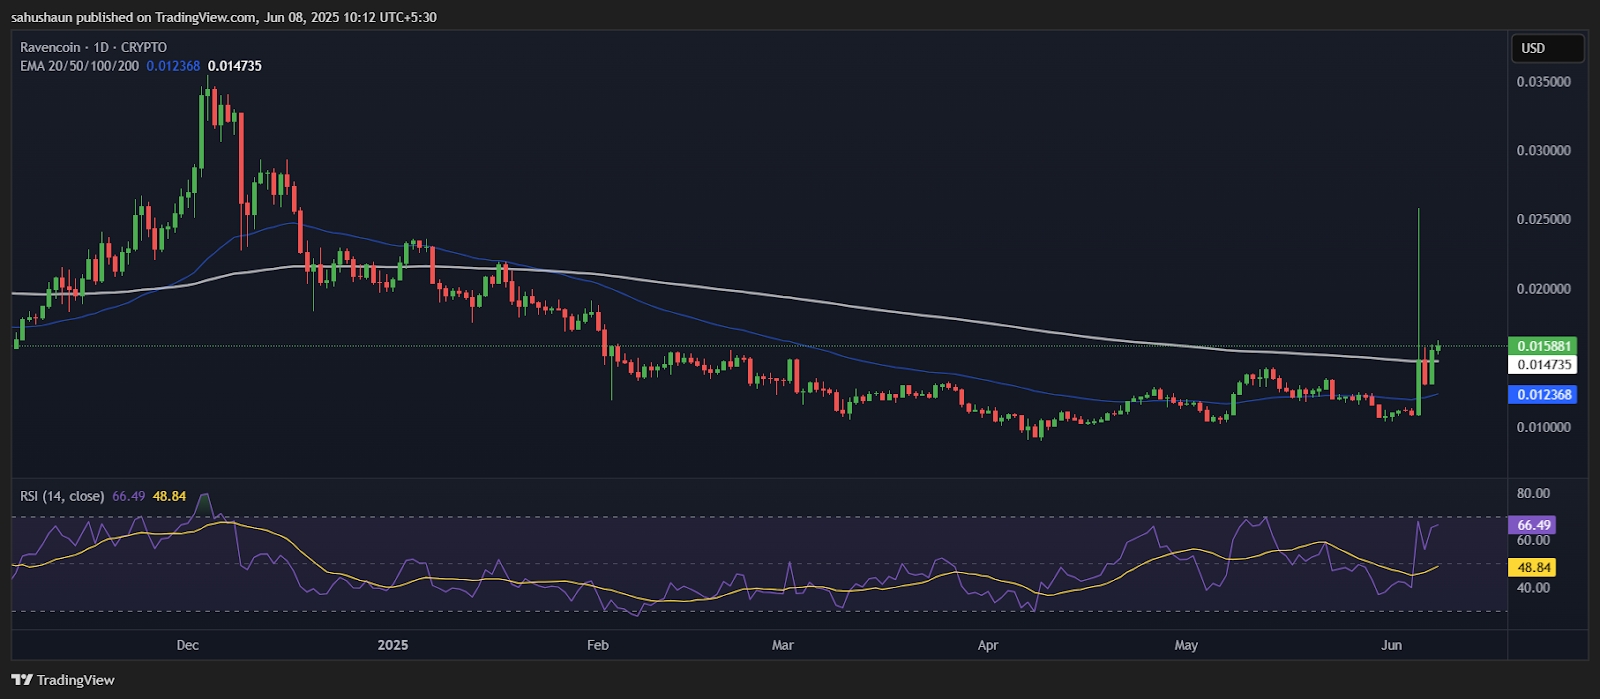
Ravencoin Price Analysis
The analysis shows price breaking above the middle band and coming close to the upper band. The bands are narrowing during consolidation, which usually indicates that the market is quiet before a big change in prices. The current growth in the bands is consistent with the breakout theory.
The AO histogram reveals that more traders are taking part in the market now, as the oscillator has clearly moved into positive territory. The increase in volume confirms the breakout and suggests that institutions or whales may be buying the asset.
Now, the broken trendline acts as a moving support point for the price around $0.012-0.013. If prices stay below this level for a while, the bullish outlook will no longer be valid. Yet, if the current trend holds, the first resistance area is expected at $0.020, which is the 38.2% Fibonacci retracement of the major fall from the January top.
The technical signs hint that RVN could be starting a new accumulation phase, and its price could rise further if the crypto market stays favourable.
#Check In Daily, Win Prizes Daily — Join the Fun!#Share Your Thoughts on Popular Assets in June#Claim1,200 USDT in the Monthly Creation Challenge
24Condividi
Tutti i commenti0RecentePopolare
Nessuno storico