

Cryptowarning
06/08 16:14
SUI Price Heads for 380% Rally
SUI Price Heads for 380% Rally with Golden Cross Formation
The golden cross is one of the most bullish patterns that often signals the start of a strong bullish trend. The crossover is evident on the daily chart after SUI’s 50-day simple moving average crossed above the 200-day simple moving average, suggesting that the ongoing uptrend may be set to continue.
The last time SUI price formed a golden cross was in the last quarter of 2024, when the price was around $1.09. Following this crossover, SUI price soared by over 380% to reach an all-time high of $5.35.
A golden crossover is currently occurring again, and if it is confirmed, it is likely that SUI price will see a huge rally and possibly reach a new all-time high. However, for this rally to occur, SUI may first need to break resistance above $4.30 before another bull run to the 161.8% Fibonacci level of $5.90 can begin.
However, to confirm the bullish momentum depicted by the SMA, the RSI must cross above 50. This metric is currently tilting north and trending strongly higher, suggesting that buying pressure is strong and this altcoin could make new highs.
However, the golden cross may not deliver significant gains like it has in the past unless there is sufficient buying support. This could happen due to bearish news, such as the SEC’s recent decision to delay approval of Canary’s spot SUI ETF. If the bullish momentum depicted by this golden cross fails to materialize, the price could fall to $2.33.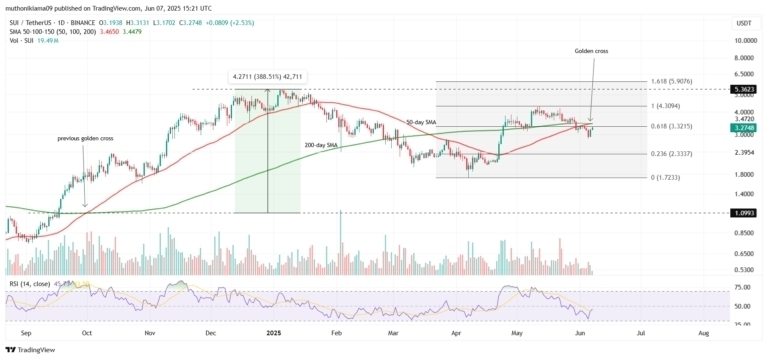
#Check In Daily, Win Prizes Daily — Join the Fun!#Share Your Thoughts on Popular Assets in June#Claim1,200 USDT in the Monthly Creation Challenge
2分享
全部評論0最新熱門
暫無記錄