Naina
06/08 11:28
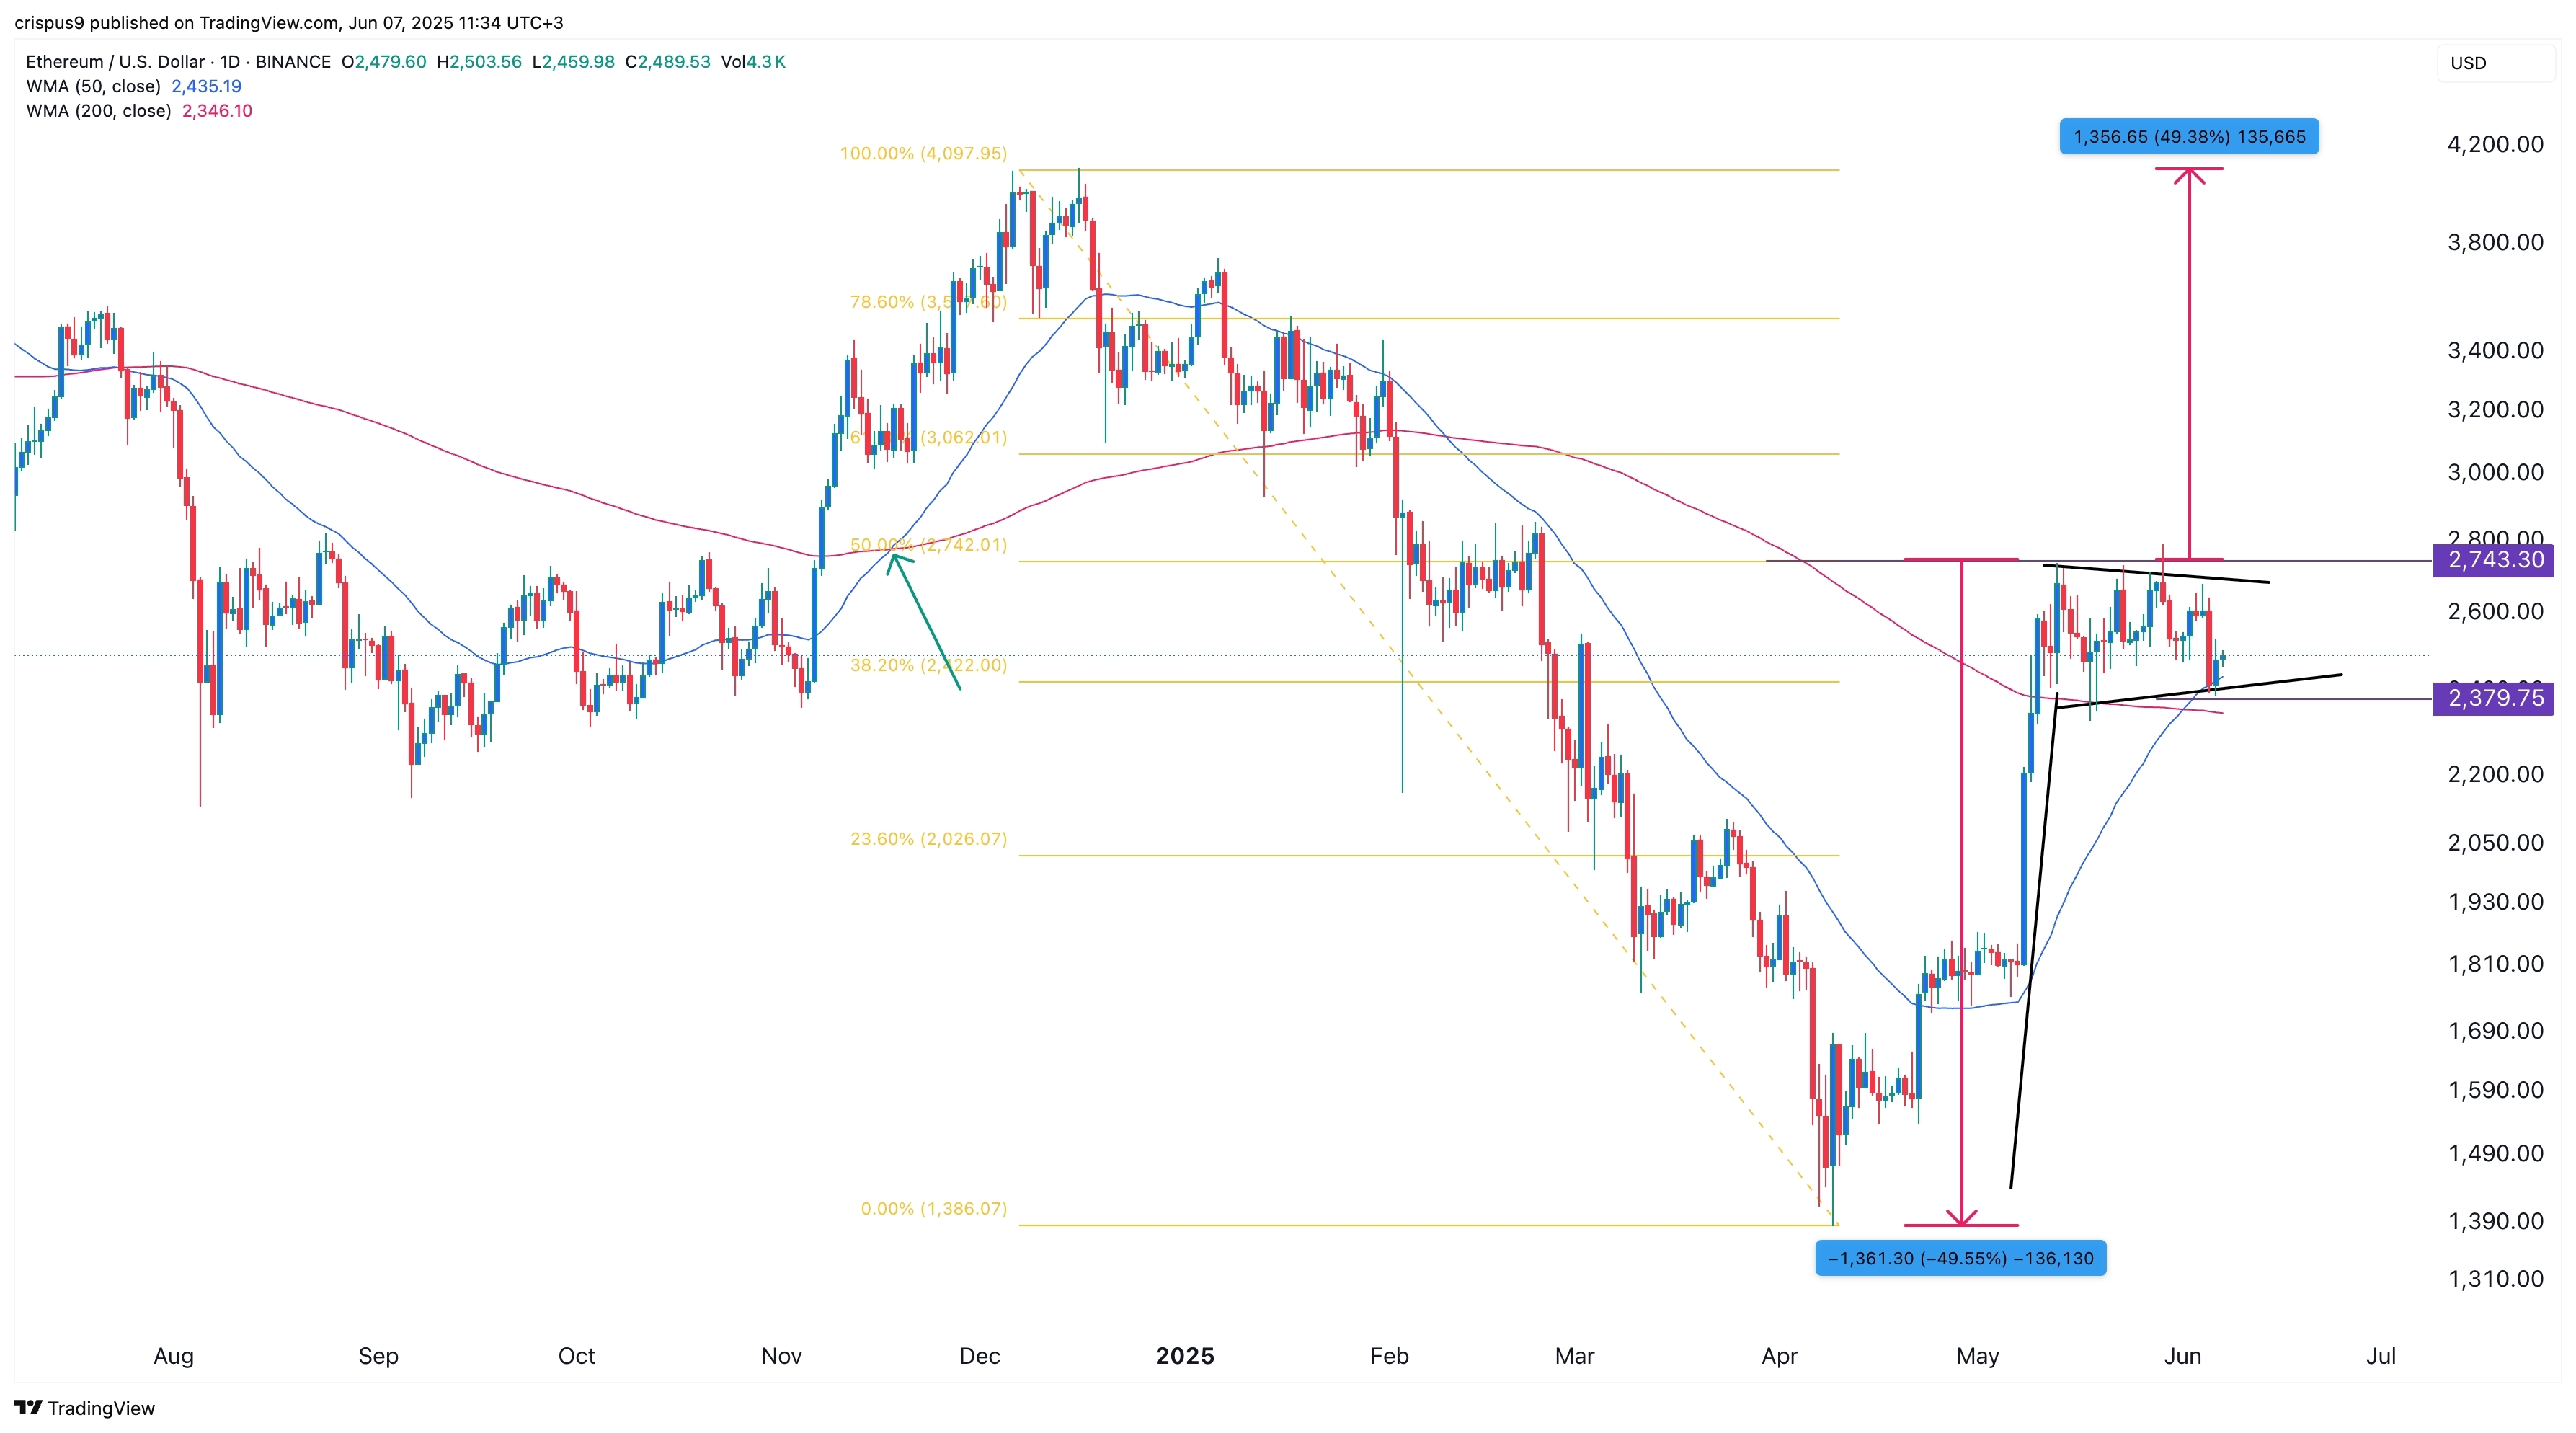
Ethereum price technical analysis The daily chart
Ethereum price technical analysis
The daily chart shows that ETH price surged in May and reached a high of $2,743, which coincided with the 50% Fibonacci Retracement level.
It has now formed a bullish flag pattern, a common bullish continuation sign. This flag pole is about 50% long, and measuring the distance from its breakout zone gives the target price of $4,097. This target coincided with its highest point in 2024.
The other bullish case is that Ethereum price has formed a golden crossover as the 50-day and 200-day Weighted Moving Averages have crossed each other. This crossover often leads to more gains. For example, it happened in November last year, triggering a 35% jump.
#Share Your Thoughts on Popular Assets in June#Check In to Win a 20g Gold Bar#Claim1,200 USDT in the Monthly Creation Challenge
按讚分享
全部評論0最新熱門