

FollowNoorr
06/08 08:16
SUI Price Gears for 380% Rally as Golden Cross Eme
SUI Price Gears for 380% Rally as Golden Cross Emerges
A golden cross is one of the most bullish patterns that often signals the beginning of a strong bullish trend. The crossover is evident on the one-day chart after SUI’s 50-day SMA crossed above the 200-day SMA, suggesting that the ongoing uptrend may continue.
The last time that SUI price formed a golden cross was during the last quarter of 2024, when the price stood at around $1.09. After this crossover happened, SUI price exploded by more than 380% and reached an all-time high of $5.35.
Currently, the golden crossover is happening again, and if it is confirmed, it is likely that SUI price will post massive gains and possibly hit a fresh all-time high. However, for this rally to happen, SUI may first need to break resistance past $4.30 before the next bull run to the 161.8% Fibonacci level of $5.90.
However, to confirm the bullish momentum depicted by the SMA, the RSI needs to cross above 50. Currently, this metric is tipping north and has made a strong upward trend, an indication that the buying pressure is strong and this altcoin could hit new highs.
However, the golden cross could fail to deliver significant gains like it did in the past if there is not enough buying support. This may happen due to bearish news, such as the recent SEC decision to delay Canary’s spot SUI ETF approval. If the bullish momentum depicted by this golden cross fails, the price may fall to $2.33.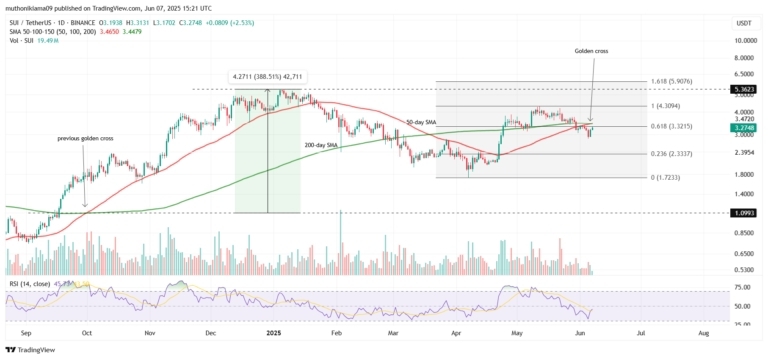
全部評論0最新熱門
暫無記錄