

Golo
06/08 04:04
Cardano price technical analysis The daily chart
Cardano price technical analysis
The daily chart shows that the Cardano price has plunged from $1.317 in December to $0.66 today. It has moved below the descending trendline that connects the highest swings since December.
Most recently, it formed a small double-top pattern at $0.845, and has moved below its neckline at $0.713, its lowest point on May 19.
It has also moved below the 50-day and 200-day Weighted Moving Averages. Therefore, the coin will likely continue falling as sellers target the next key support at $0.513, its lowest point in April, down by 23% from the current level.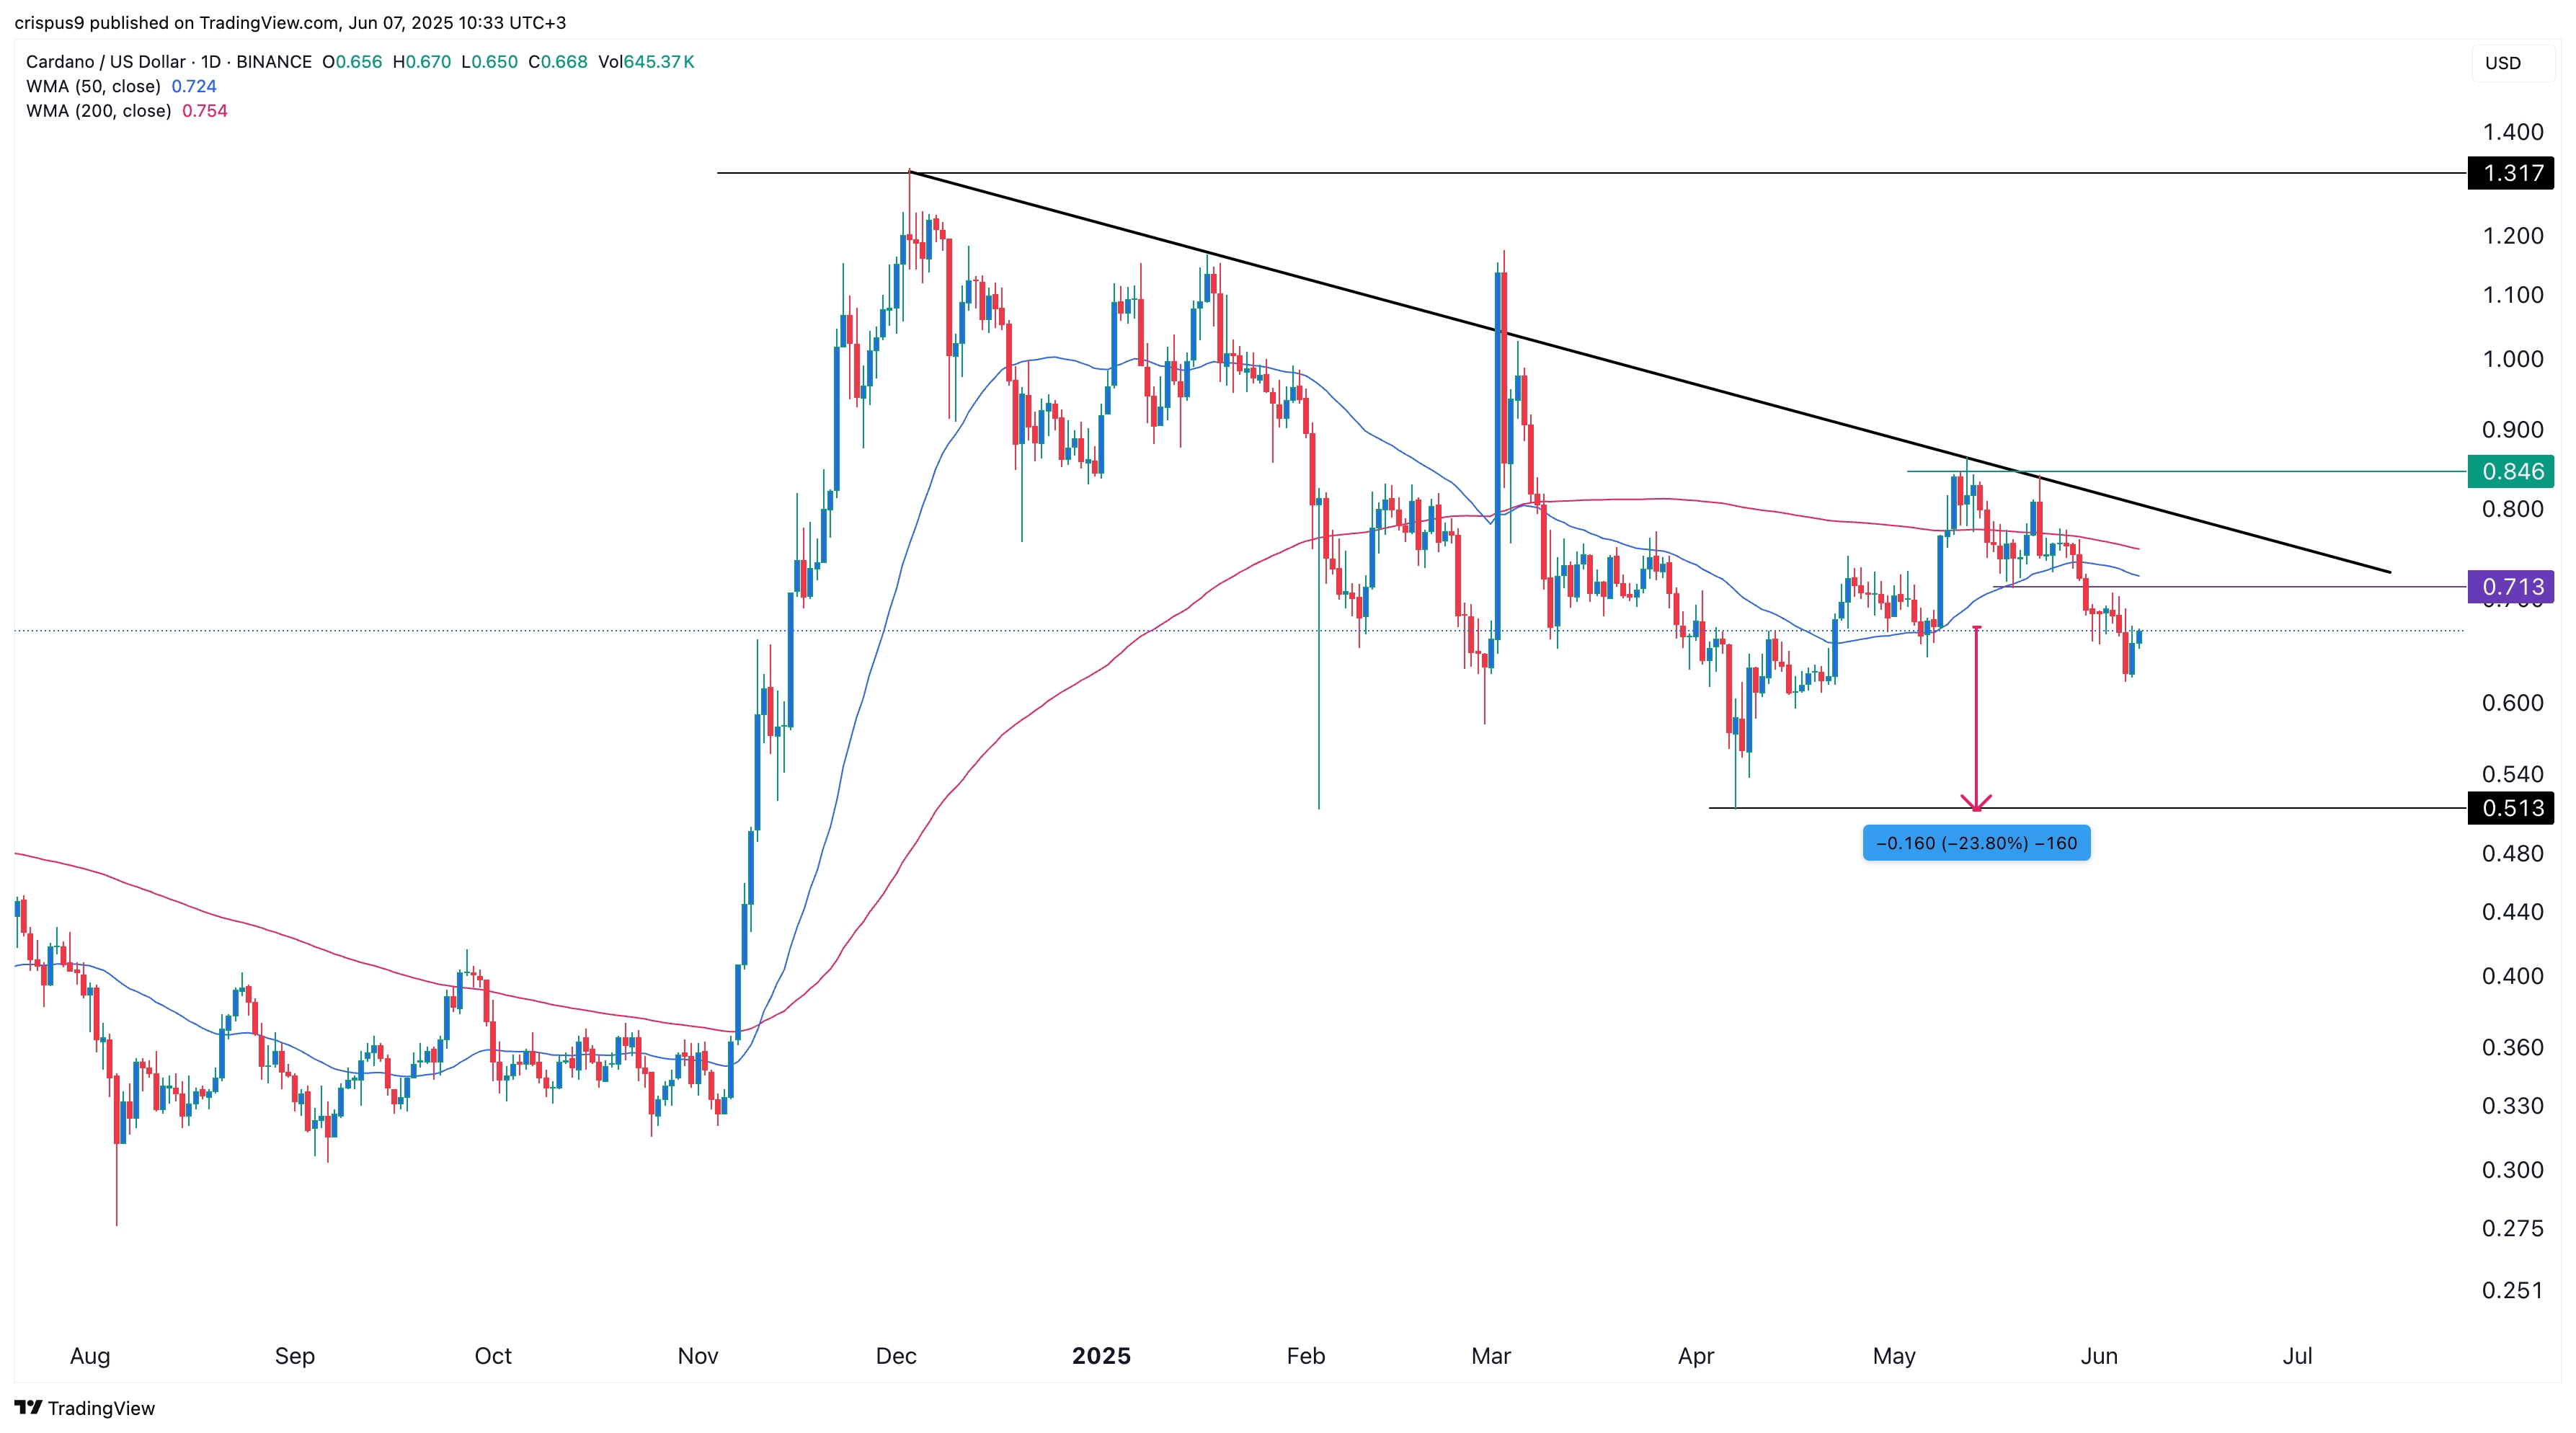
#Check In Daily, Win Prizes Daily — Join the Fun!#Trump-Musk spat sees Bitcoin tumble#Share BTC or ETH Futures Trades
3分享
全部評論0最新熱門
暫無記錄