

Trading King
06/08 03:06
Is Bitcoin painting a bearish reversal setup?
Is Bitcoin painting a bearish reversal setup?
Bitcoin is painting what appears to be an inverse cup-and-handle pattern, with its neckline near $100,800 acting as current support. As of June 7, the price has entered the handle-formation stage, eyeing a breakdown below the neckline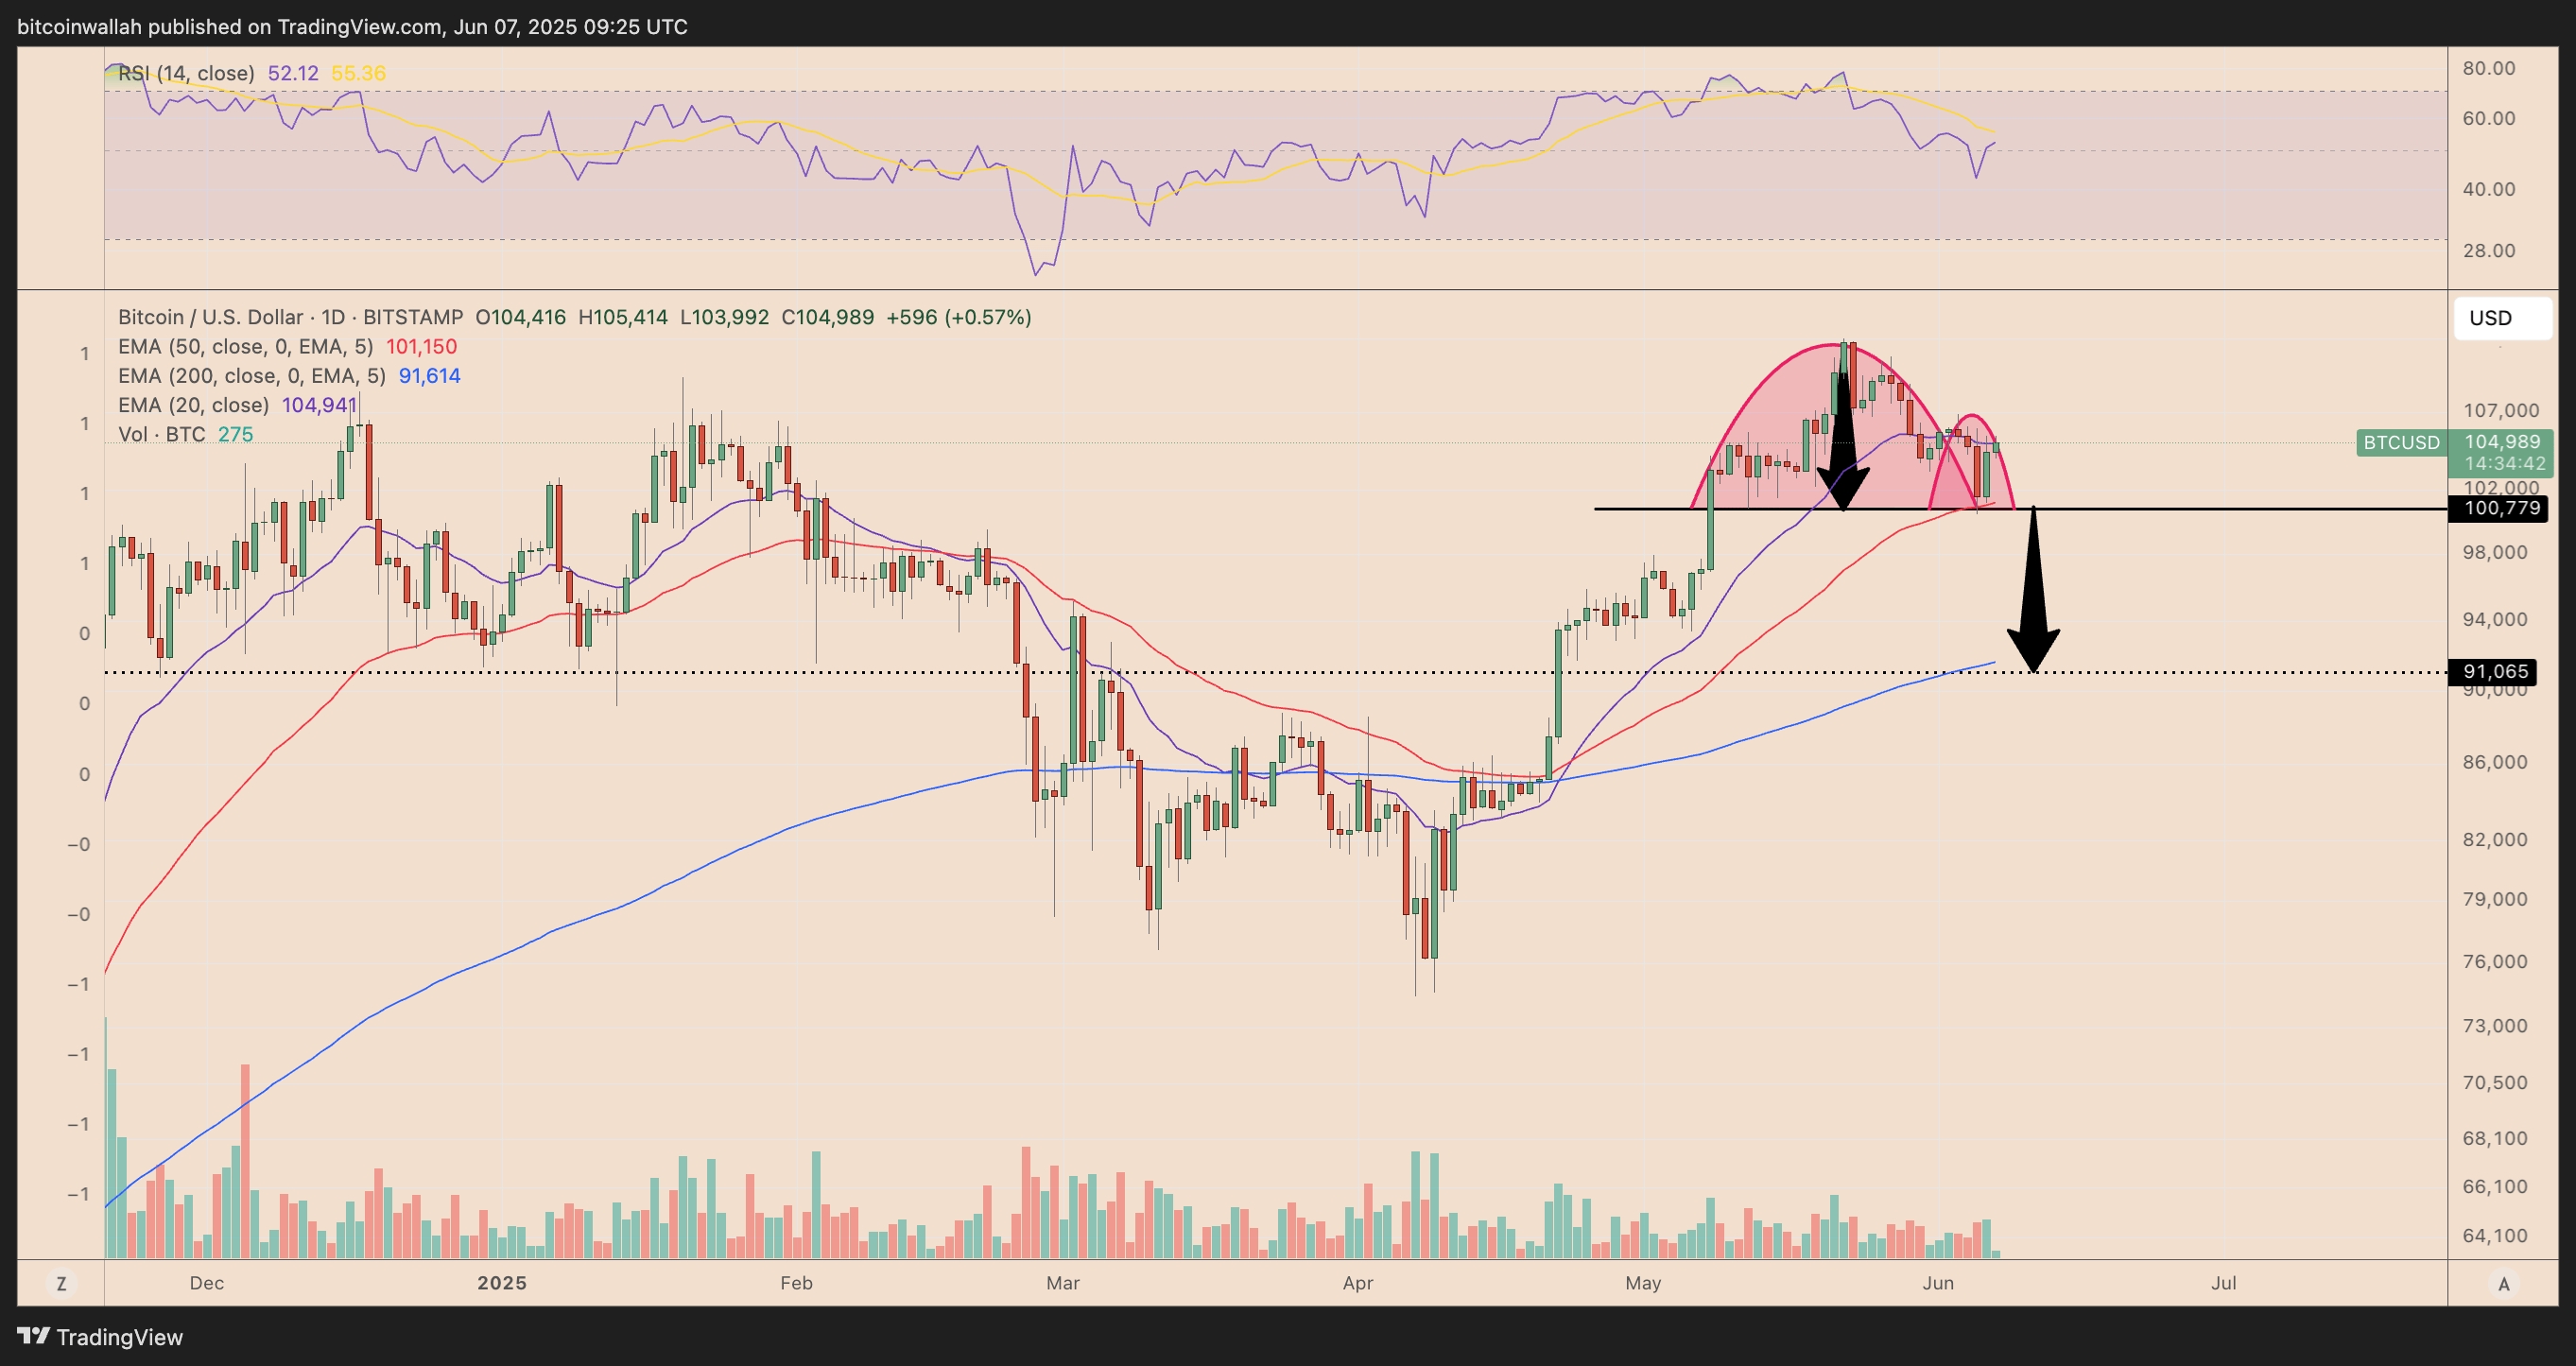
Based on the inverse cup-and-handle pattern setup, a breakdown below $100,800 will increase Bitcoin’s likelihood of dropping toward $91,000.
The $91,000 downside target aligns with BTC’s 200-day exponential moving average (200-day EMA; the blue wave).
Bitcoin’s relative strength index (RSI) has declined in tandem with its price, signaling strong trader conviction behind the ongoing sell-off.
As of June 7, the RSI reading was 52, reflecting a weakening upside momentum; a break below 50 could intensify downside pressure.
To regain control, bulls must reclaim Bitcoin’s 20-day EMA (the purple wave) resistance at around the $105,000 level. A drop toward $91,000 could effectively lower BTC’s potential of hitting $150,000 by 2025’s end.
全部评论0最新最热
暂无记录